
Still searching for the right place?
Use Map AI to explore, compare, and find the best fit - all with detailed insights and smart reports on any neighborhood.

How to Get Trade Area Demographics in Seconds

September 16, 2026

3 min to read
How to get demographic insights for a 15-minute drive-time trade area in seconds
TLDR: enter an address, then in the menu that appears choose the "15 min drive" trade area, and get demographic data accurate for the exact trade area.
Here's a brief guide on how to get demographic data for your trade area using Map AI.
Open the map at interactive-map-ai.com and enter any US address. Let's say 240 Bedford Ave, Brooklyn, NY 11249.
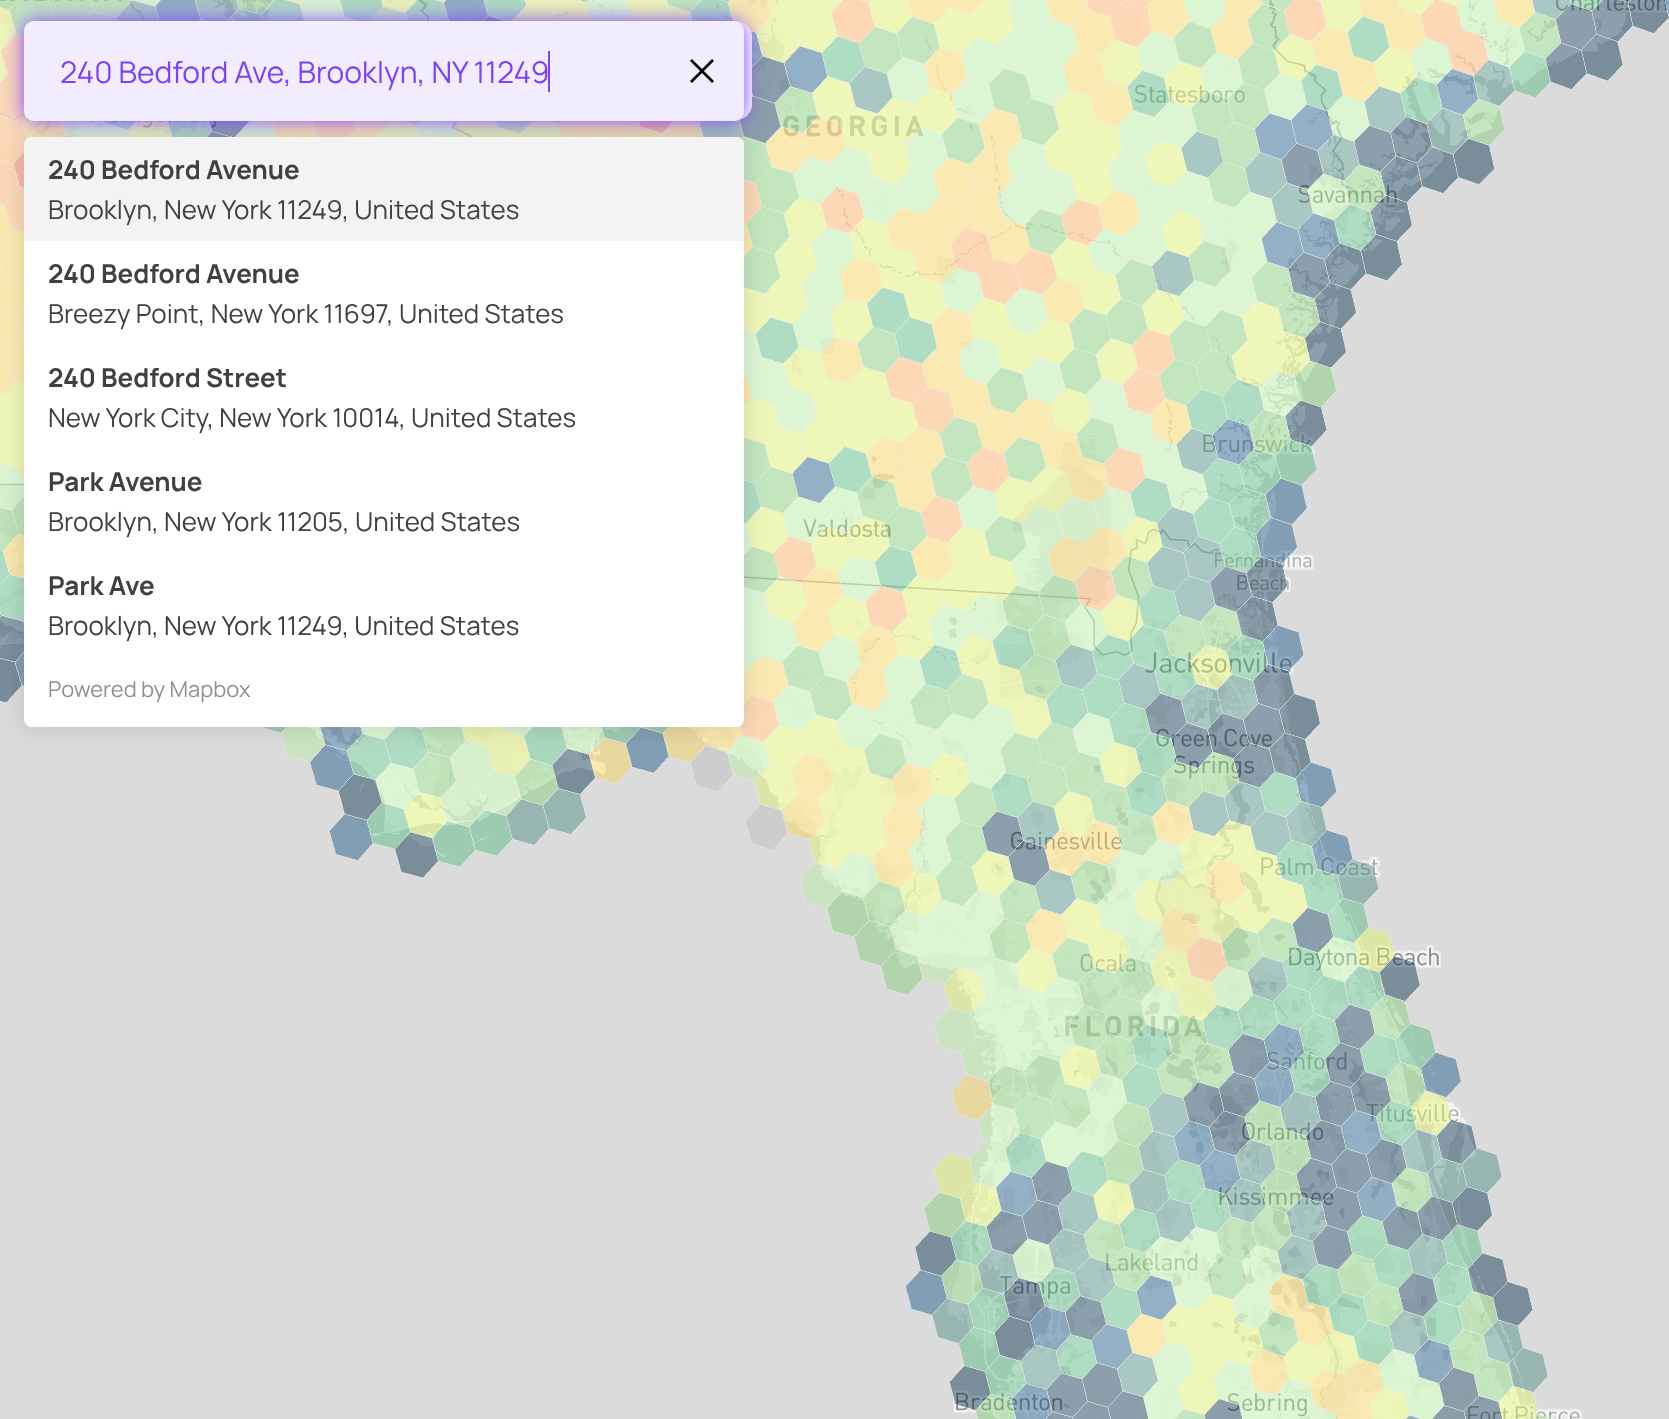
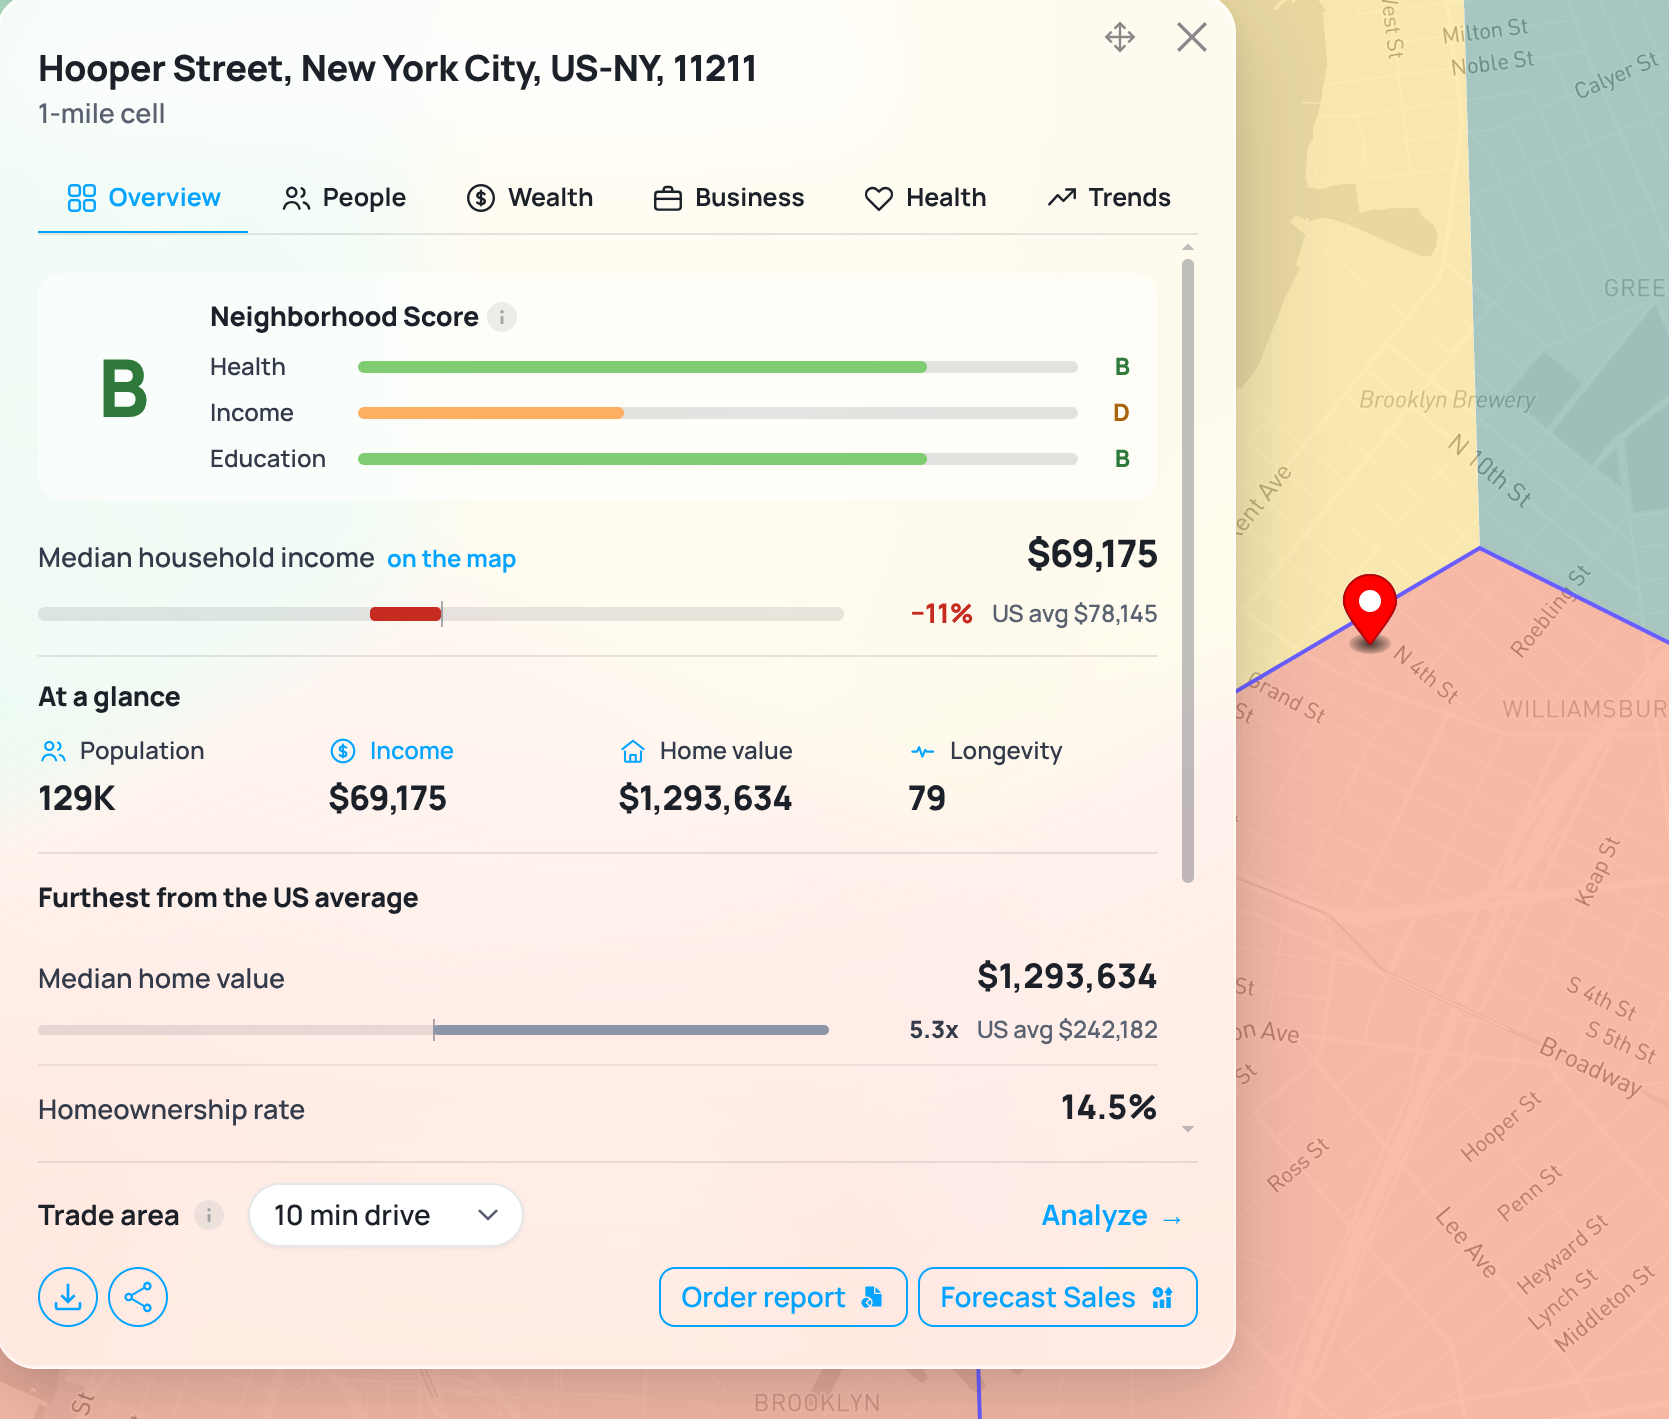
You'll instantly see local demographics for the nearest 1-mile cell. As you can see in the picture, this address sits right on the corner between cells, where demographics can vary a lot: this cell has a median household income of $69,175, 11% below the $78,145 US average, and an overall Neighborhood Score of B.
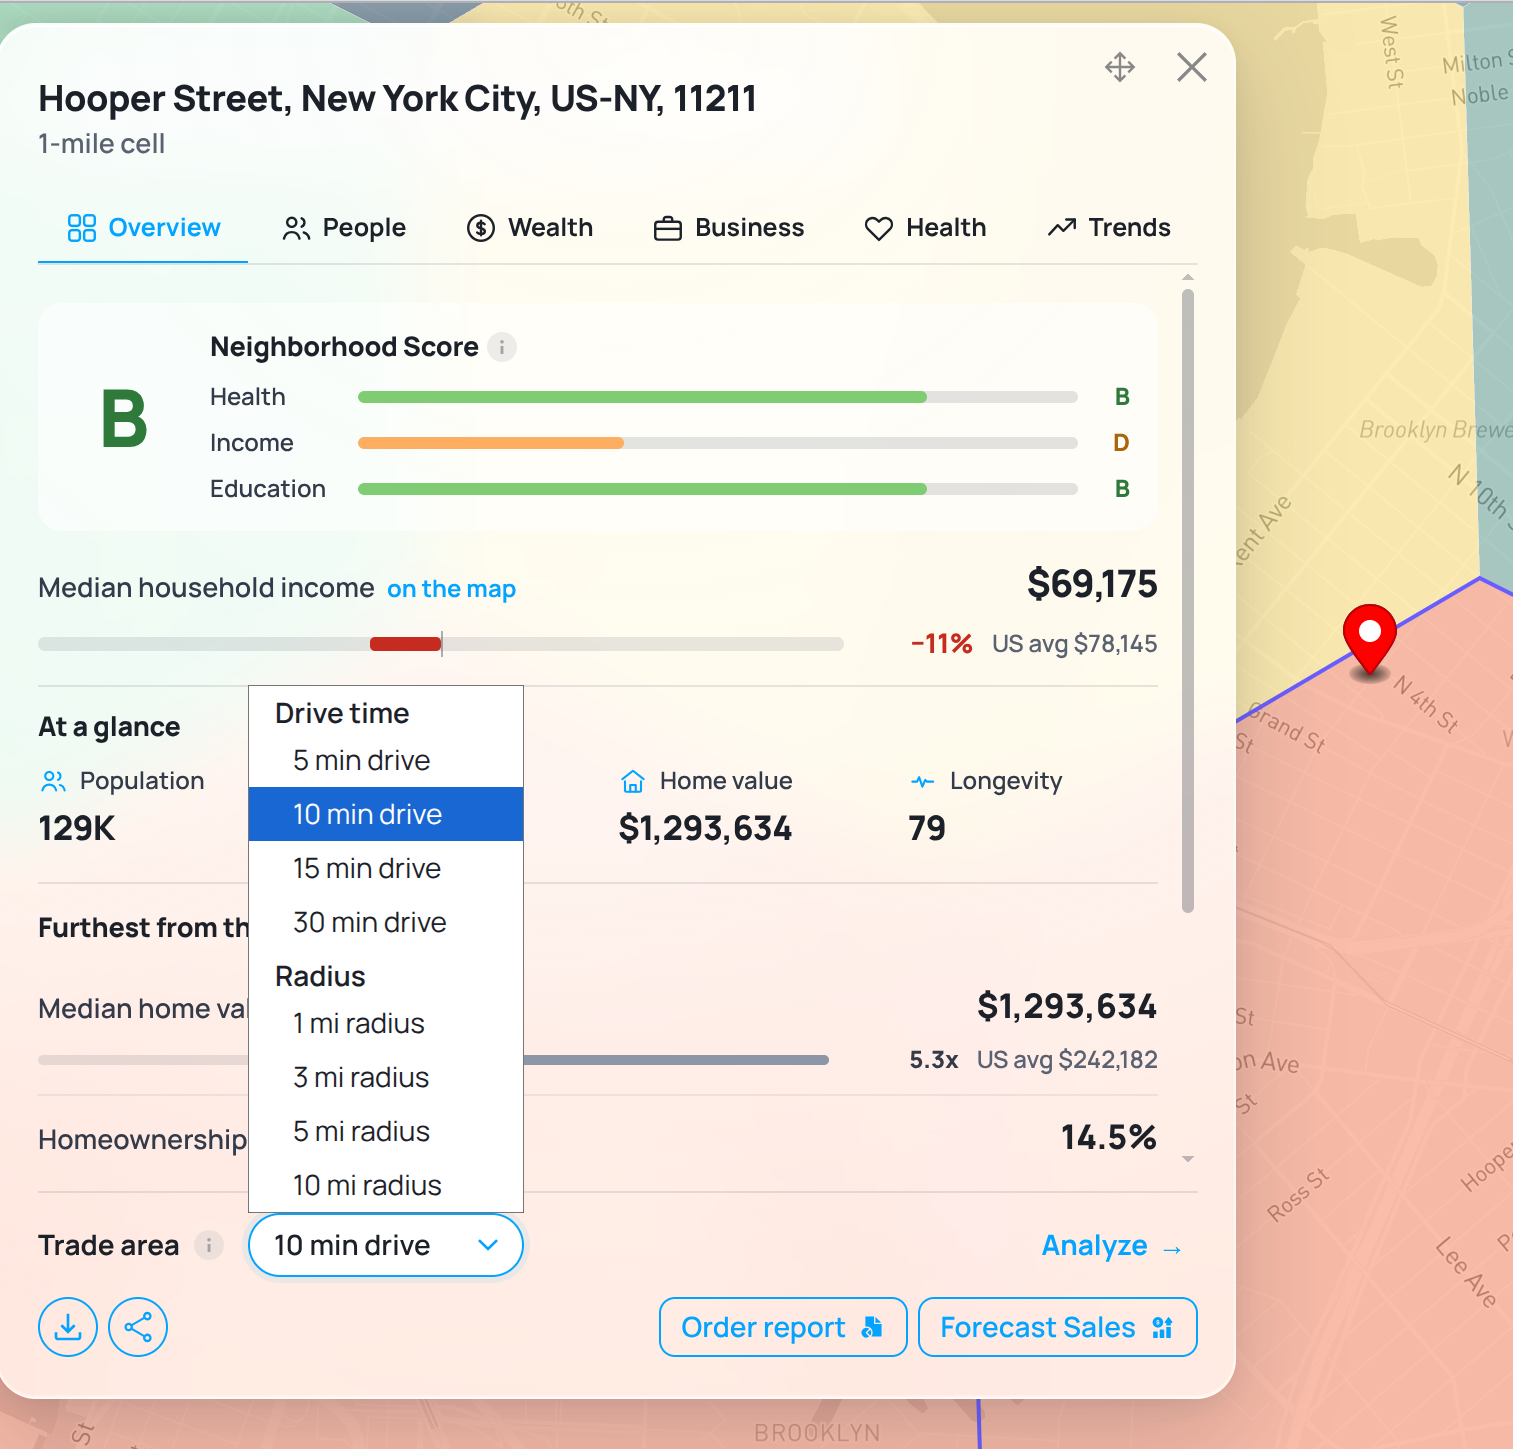
To get demographics within a drive time (or mile radius) instead, choose the trade area parameters in the lower part of the popup and click Analyze.
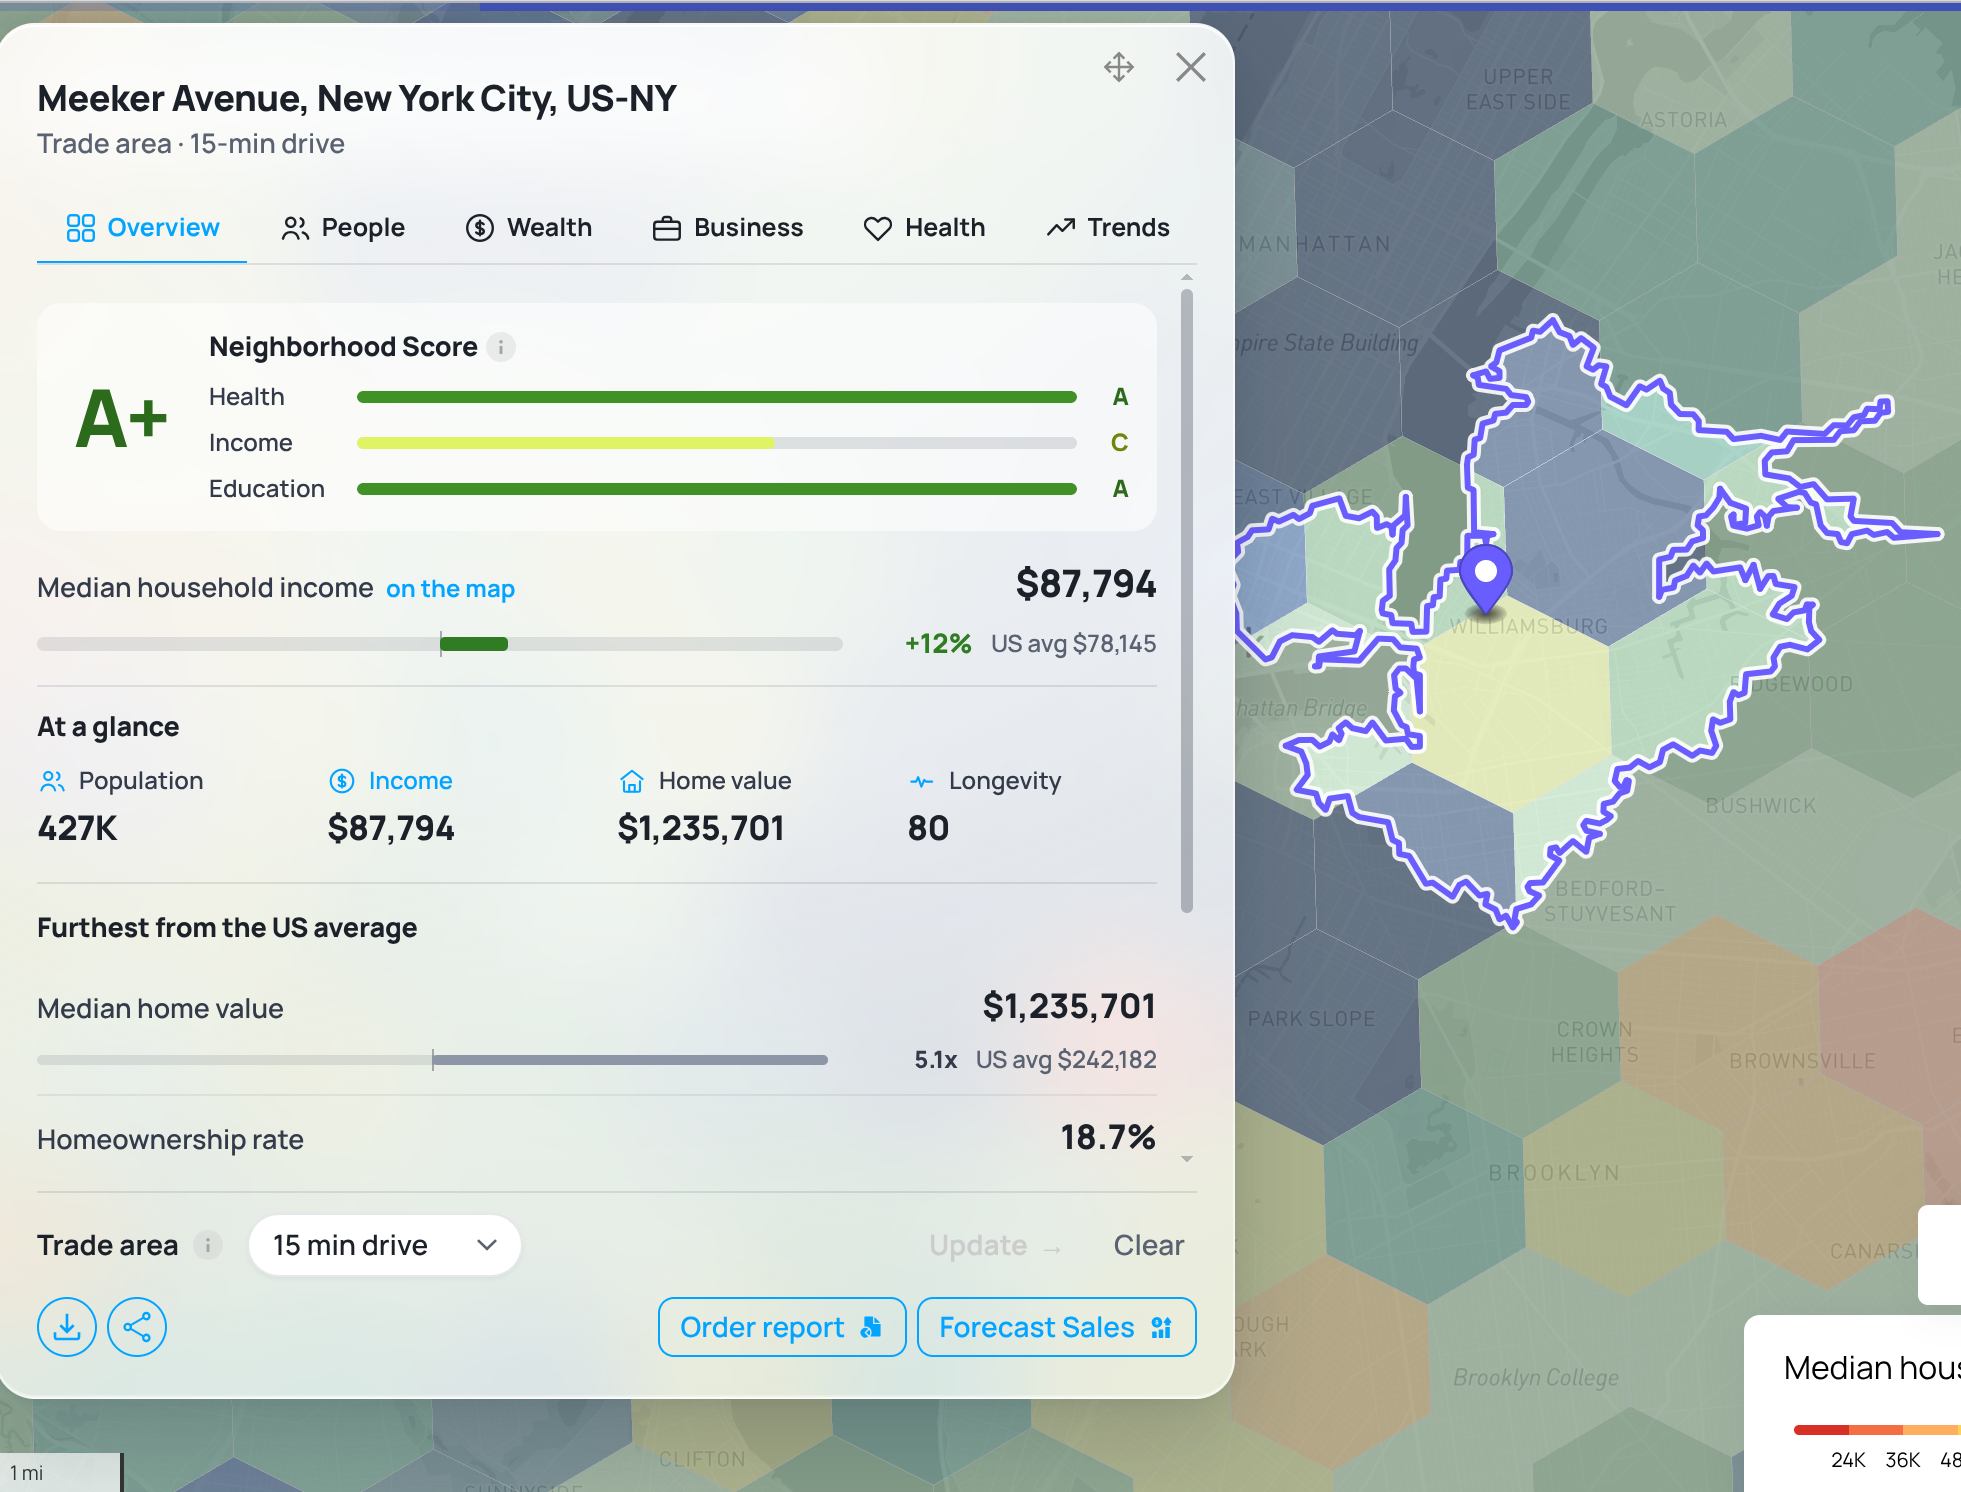
Within a few seconds, our algorithms first calculate the actual drive distance, factoring in typical traffic at a typical time of day (powered by Mapbox). Then we aggregate recent, granular demographic data across the whole trade area: the most granular Census data available, based on census blocks and tracts, averaged according to geographic and population shape, compared against state and country averages, and rolled up into our own neighborhood scores, ready to use.
Making location decisions based on trade area
In this example, even a brief look at the data reveals insights useful for business and investment decisions. For the 15-minute drive-time trade area, the Neighborhood Score jumps to A+, median household income rises to $87,794 (12% above the US average), and the population within reach grows to 427K.
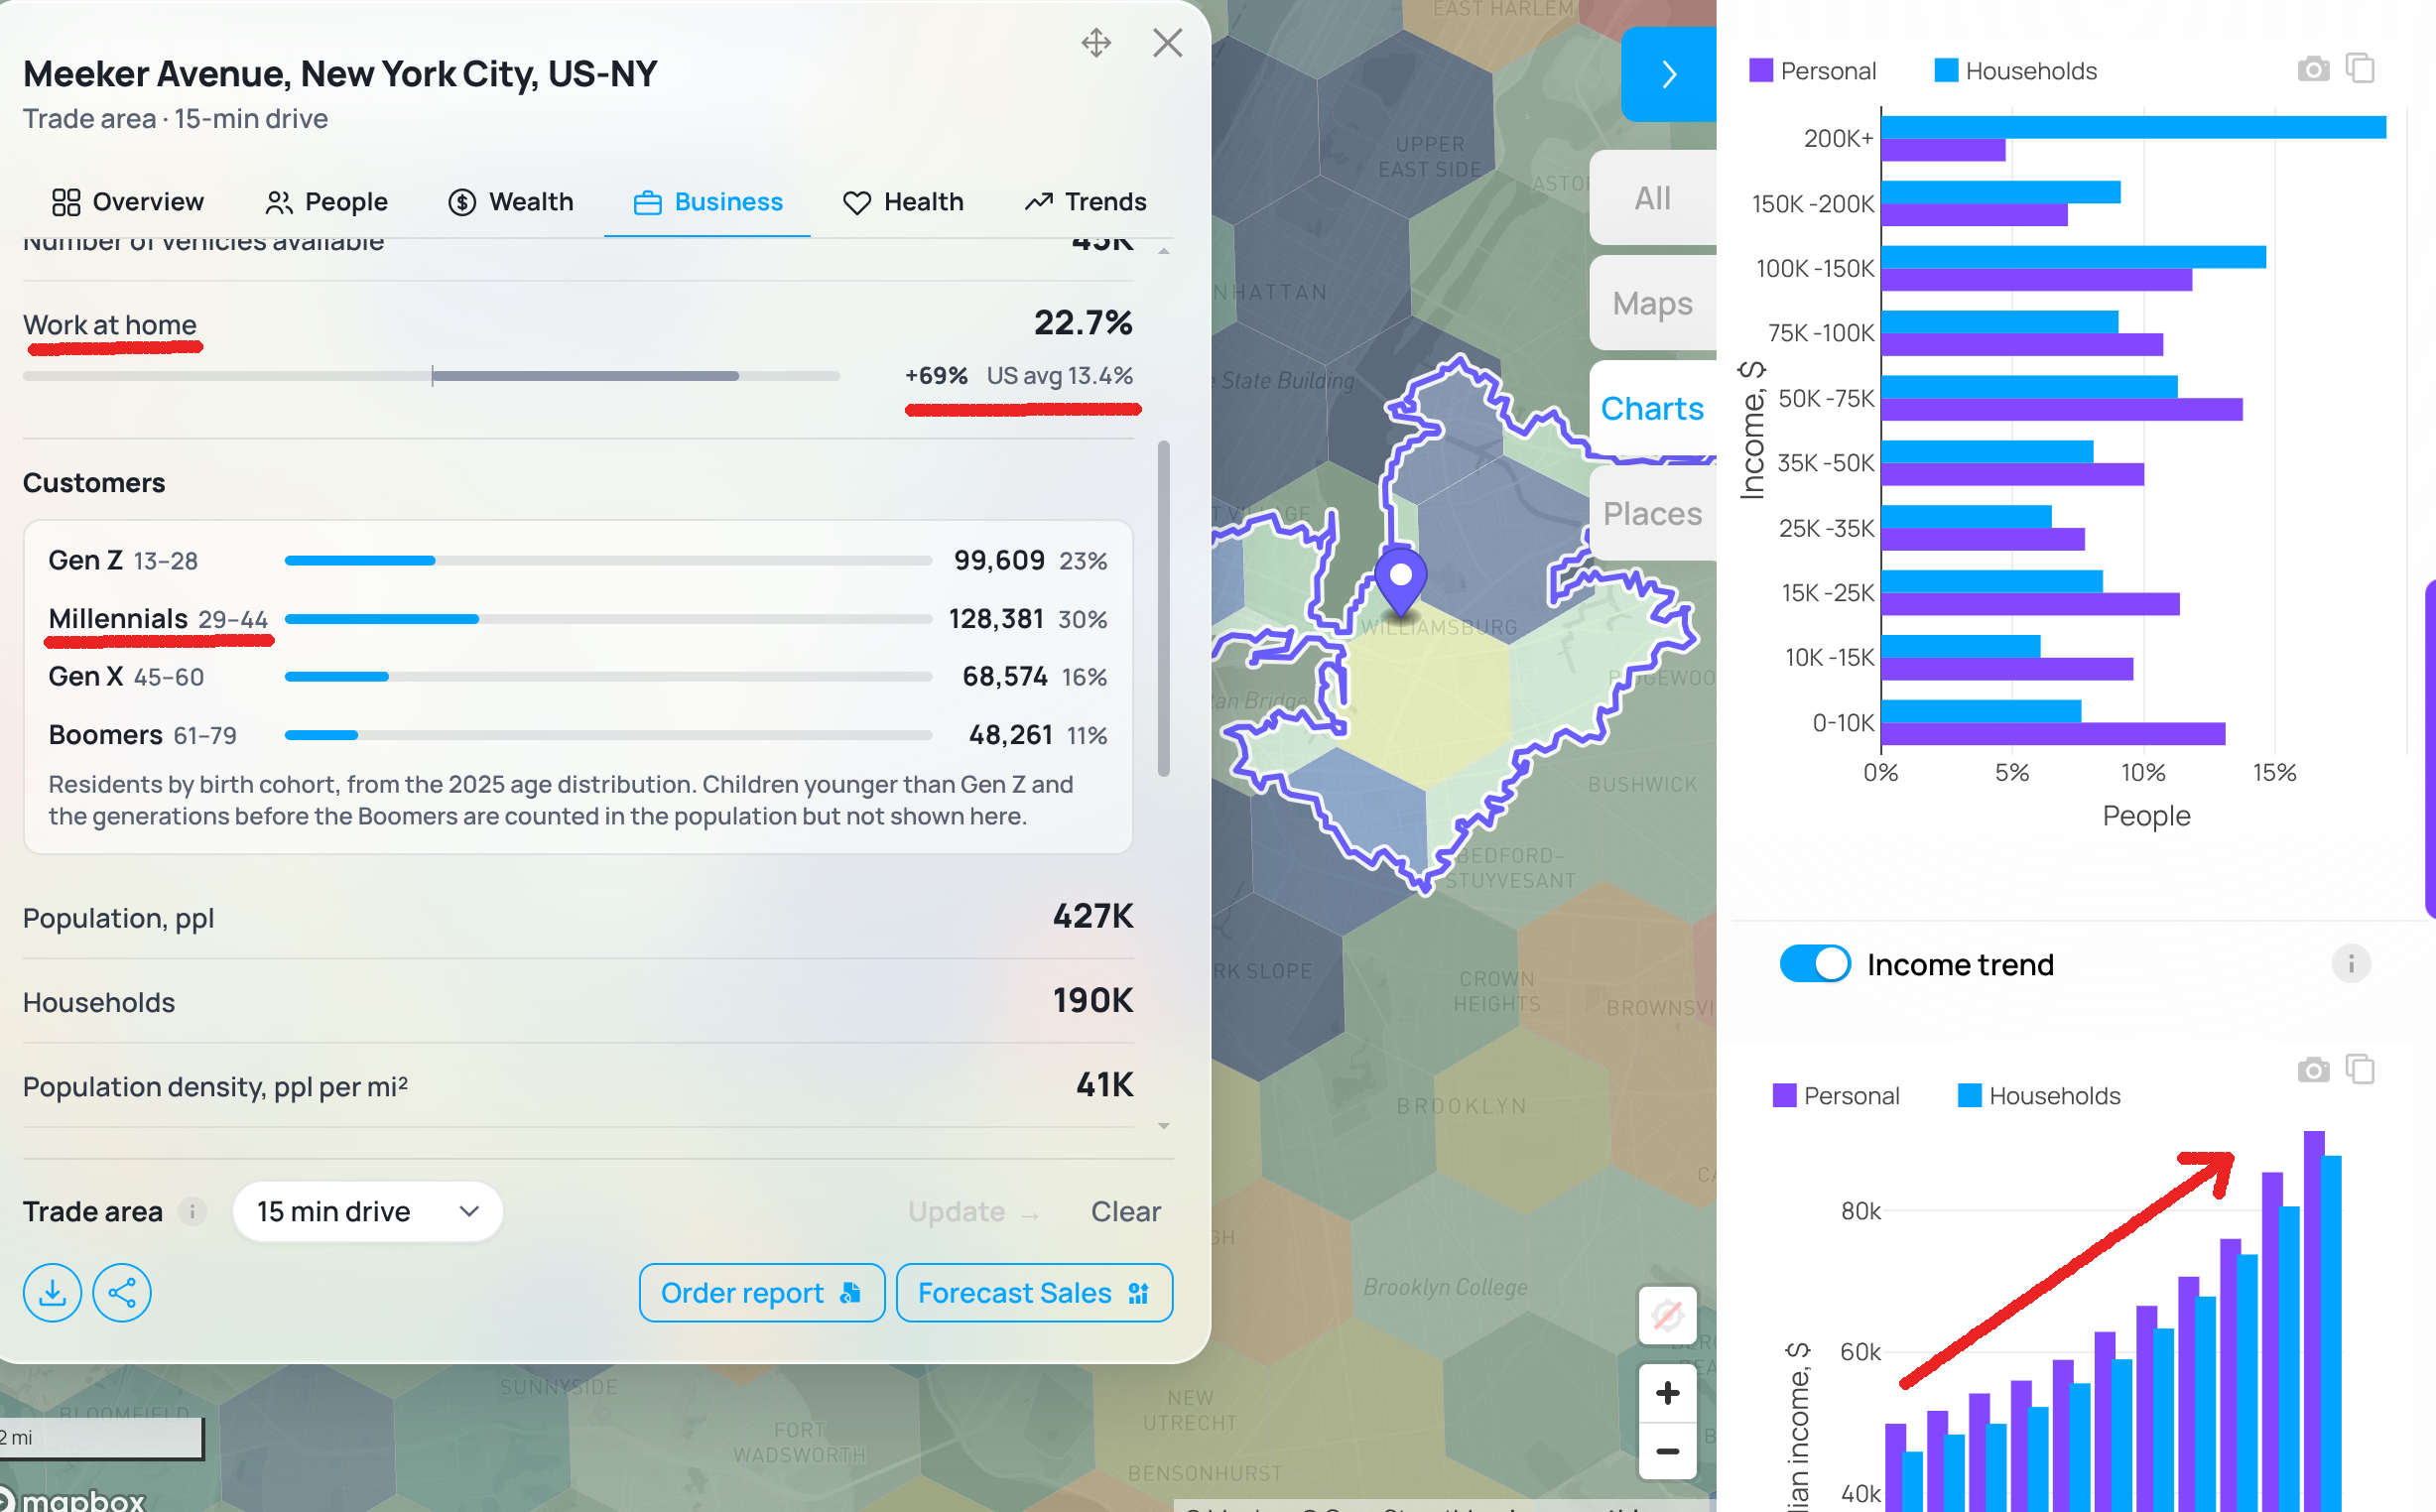
There's a huge percentage of people working from home: 22.7%, or 69% above the 13.4% US average. Millennials (29-44 years) are the largest generational group at 30% of the population, ahead of Gen Z at 23%, Gen X at 16%, and Boomers at 11%. The income trend chart shows both personal and household median income climbing steadily. These observations take less than a minute to spot, but they already give you pretty good signals for operating in this area and expecting positive outcomes for business or living there.
You can check other indicators too, such as marital status (spoiler: there's a high share of unmarried population), commute, and education patterns.
Running a trade area analysis is free once you create a Map AI account. Many of the detailed indicators inside that trade area, though, are available only with a paid subscription.
You have four options to go even deeper:
- PDF report - a full downloadable report (a guide is coming soon; for now, explore it on the site)
- Compare locations - a side-by-side trade area comparison (a guide is coming soon; for now, explore it on the site)
- Forecast sales - business and competitor analysis
- AI Chat - a copilot for location research
We'll go deeper into demographics reports in a follow-up post.
See more
Source: US Census Bureau (American Community Survey) and Map AI.

Retirement-friendly

or dominated by young professionals.

Understanding factors like age demographics, neighborhood income, crime rates, and education ranking allows you to feel the vibe of the area more deeply. With Map AI, it’s a breeze to dig into the demographics of any area!
Open mapInstead of manually compiling data from multiple sources, our platform provides real-time insights, saving you time and effort while delivering accurate and actionable information.
Here’s how it works:
1. Launch the platform in your browser.
2. Find the location you’re interested in, by entering an address on the left.
3. Choose the level of data granularity – 1 mi, 5 mi, county or a state.
4. In the menu bar on the right, go to the "Charts" section and select "Population".
5. Click on the neighborhood you’re curious about to view the data.
And voilà!
An interactive map pops up, layered with data on age groups, income brackets, education levels, and even population density.

It’s like having a real estate crystal ball! Whether you’re prioritizing schools, nightlife, or a specific community vibe, Map AI helps you match your lifestyle to the perfect spot. No more guessing or endless Googling—just actionable insights in a few clicks.
Ready to explore? Head to https://interactive-map-ai.com/ and start mapping your future neighborhood today!
Map AI makes exploring demographics easy with its interactive, user-friendly platform. Offering detailed maps and customizable filters, Map AI lets you visualize key demographic data such as age distribution, population density by county, by zip and less, median household income map, and family structures across different neighborhoods. You can access real-time data to make more informed decisions about where to live based on the community that best matches your needs and lifestyle.
Open mapBy using Map AI, you’ll save time and gain a deeper understanding of your potential new home, ensuring you choose the perfect neighborhood for your future.
Check my neighborhoodHere’s why school rankings matter and how Map AI can help you make the best choice.
Why school rankings matter1. Property Value Impact
Homes located in areas with top-rated schools tend to have higher property values and greater potential for long-term appreciation. School quality is a key factor that many homebuyers consider, even if they don’t have children, because it signals a desirable neighborhood with solid community investment.2. Better Educational Opportunities
For families, the proximity to high-ranking schools can be a major deciding factor. Good schools provide better educational opportunities for children, which can translate into future success. Access to quality education is often viewed as a key benefit of living in certain neighborhoods.3. Community Environment
A strong school system often attracts young families, creating a vibrant, family-friendly community. This can lead to a positive social environment with access to various community activities, events, and local organizations.
How Map AI makes comparing school districts simple
Map AI simplifies the process of comparing school districts by offering interactive maps that display school rankings across different neighborhoods.

With just a few clicks, you can visualize how schools in a specific area stack up against each other, compare performance ratings, and see reviews from local residents.
Open mapBy using Map AI, you can make informed decisions about where to buy, ensuring that the neighborhood not only fits your lifestyle but also provides access to the best educational opportunities. Whether you're focused on top-performing schools or simply want to know how a school compares in the area, Map AI makes this data easily accessible and actionable.
Incorporating school rankings into your property search is easy when you have the right tools. With Map AI, you can confidently select a neighborhood that provides excellent education for your children and enhances your home’s long-term value.
For a comprehensive, data-driven approach to analyze a neighborhood, Map AI is the tool you can't afford to miss.
Compare neighborhoodsHow Map AI makes сrime heatmaps easy to use
Map AI takes the power of crime heatmaps to the next level with its user-friendly platform. With just a few clicks, you can explore crime rates by neighborhood that display real-time crime data across America. Map AI’s intuitive interface allows you to customize filters, adjusting the map based on the type of crime you're concerned about, such as violent crimes or property thefts.
You can also zoom in on specific areas to see localized crime patterns, giving you a more detailed view of safety at a granular level. The easy-to-read heatmap visuals make it simple to compare areas, helping you narrow down the safest areas to live in with confidence.
By using Map AI, you get access to accurate, real-time crime data in an easy-to-understand format, making it a must-have tool in your homebuying journey. With Map AI you can make informed decisions that prioritize your safety and peace of mind.
Let us help guide you to the safest places for your next home.

Then select “Filters” from the menu on the right side, choose "Housing" – “Median gross rent” / “ Median home value”, and set your budget.

The map highlights these towns in green, showing median home prices and rental rates.

Zoom in to explore schools, parks, and shopping options—everything a homebuyer needs to decide. Forget endless searches; Map AI puts affordability and convenience on one screen. Check it out at https://interactive-map-ai.com and start planning your move today!
Just for you
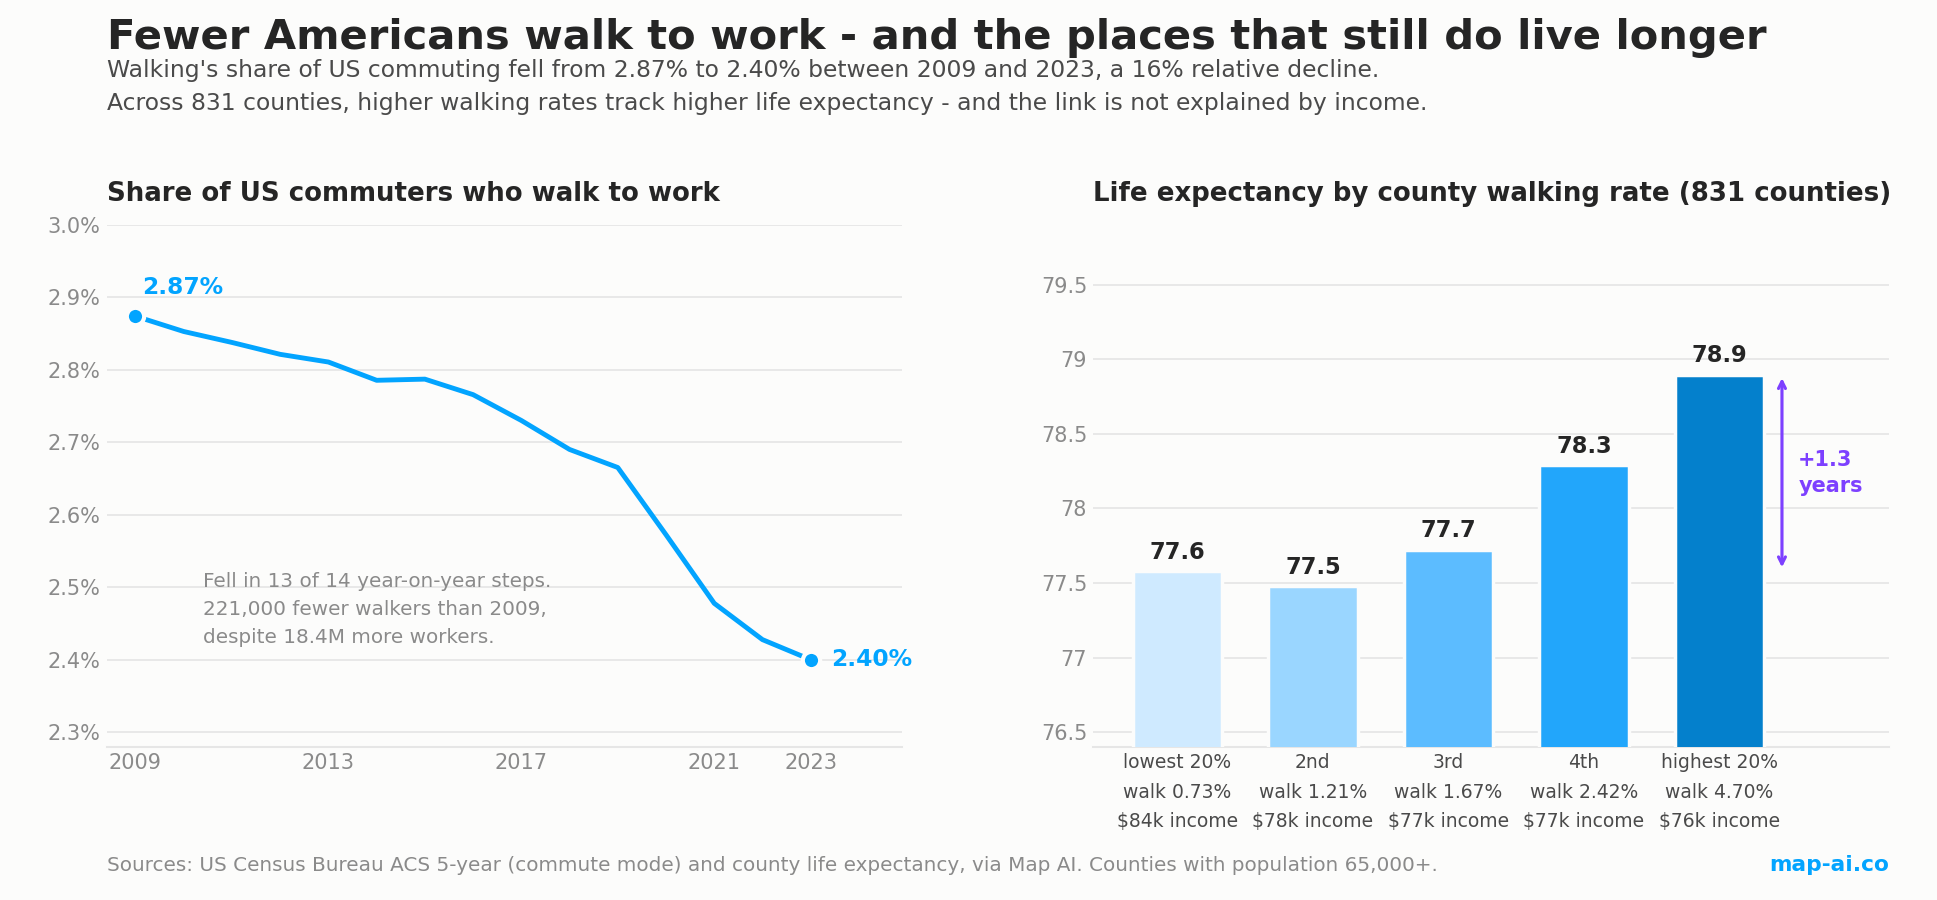
America on Foot: Where People Still Walk to Work, and Why It Tracks Life Expectancy
Walking's share of US commuting fell from 2.87% to 2.40% since 2009. We map where Americans still walk, where nobody does, and how it tracks life expectancy.
Read more
Still searching for the right place?
Use Map AI to explore, compare, and find the best fit - all with detailed insights and smart reports on any neighborhood.


