
Still searching for the right place?
Use Map AI to explore, compare, and find the best fit - all with detailed insights and smart reports on any neighborhood.

Sedentary Rates by State: The Most and Least Active US States


October 29, 2025

3 min to read
Kentucky has the highest sedentary rate of any US state: 34.0% of adults report no leisure-time physical activity, according to 2020 CDC estimates compiled by Map AI. Louisiana (33.8%) and Arkansas (33.0%) follow, all well above the 25.1% US rate.
Utah has the lowest sedentary rate of any US state at 18.2% of adults, followed by Hawaii (19.0%) and Rhode Island (19.1%). The least sedentary states are split between the mountain and Pacific West and New England.
The South is the most sedentary region: all 10 of the states with the highest share of inactive adults are Southern, from Kentucky at 34.0% to Texas at 29.2%, according to Map AI's state data.
Yes. Across the 50 states, higher sedentary rates go with shorter lives in Map AI's data (r = -0.88). Kentucky, Louisiana, Mississippi and Alabama are among both the most sedentary states and the five with the shortest life expectancy.
Largely, yes. Kentucky has both the highest sedentary rate (34.0%) and the highest smoking rate (26.0%) of any state, and Utah is lowest on both, at 18.2% sedentary and 11.3% smoking, in Map AI's data.
No. Georgia's sedentary rate is 30.5%, eighth among states in Map AI's data, not the 38% an earlier version of this article reported. Kentucky is highest at 34.0%.
Just for you
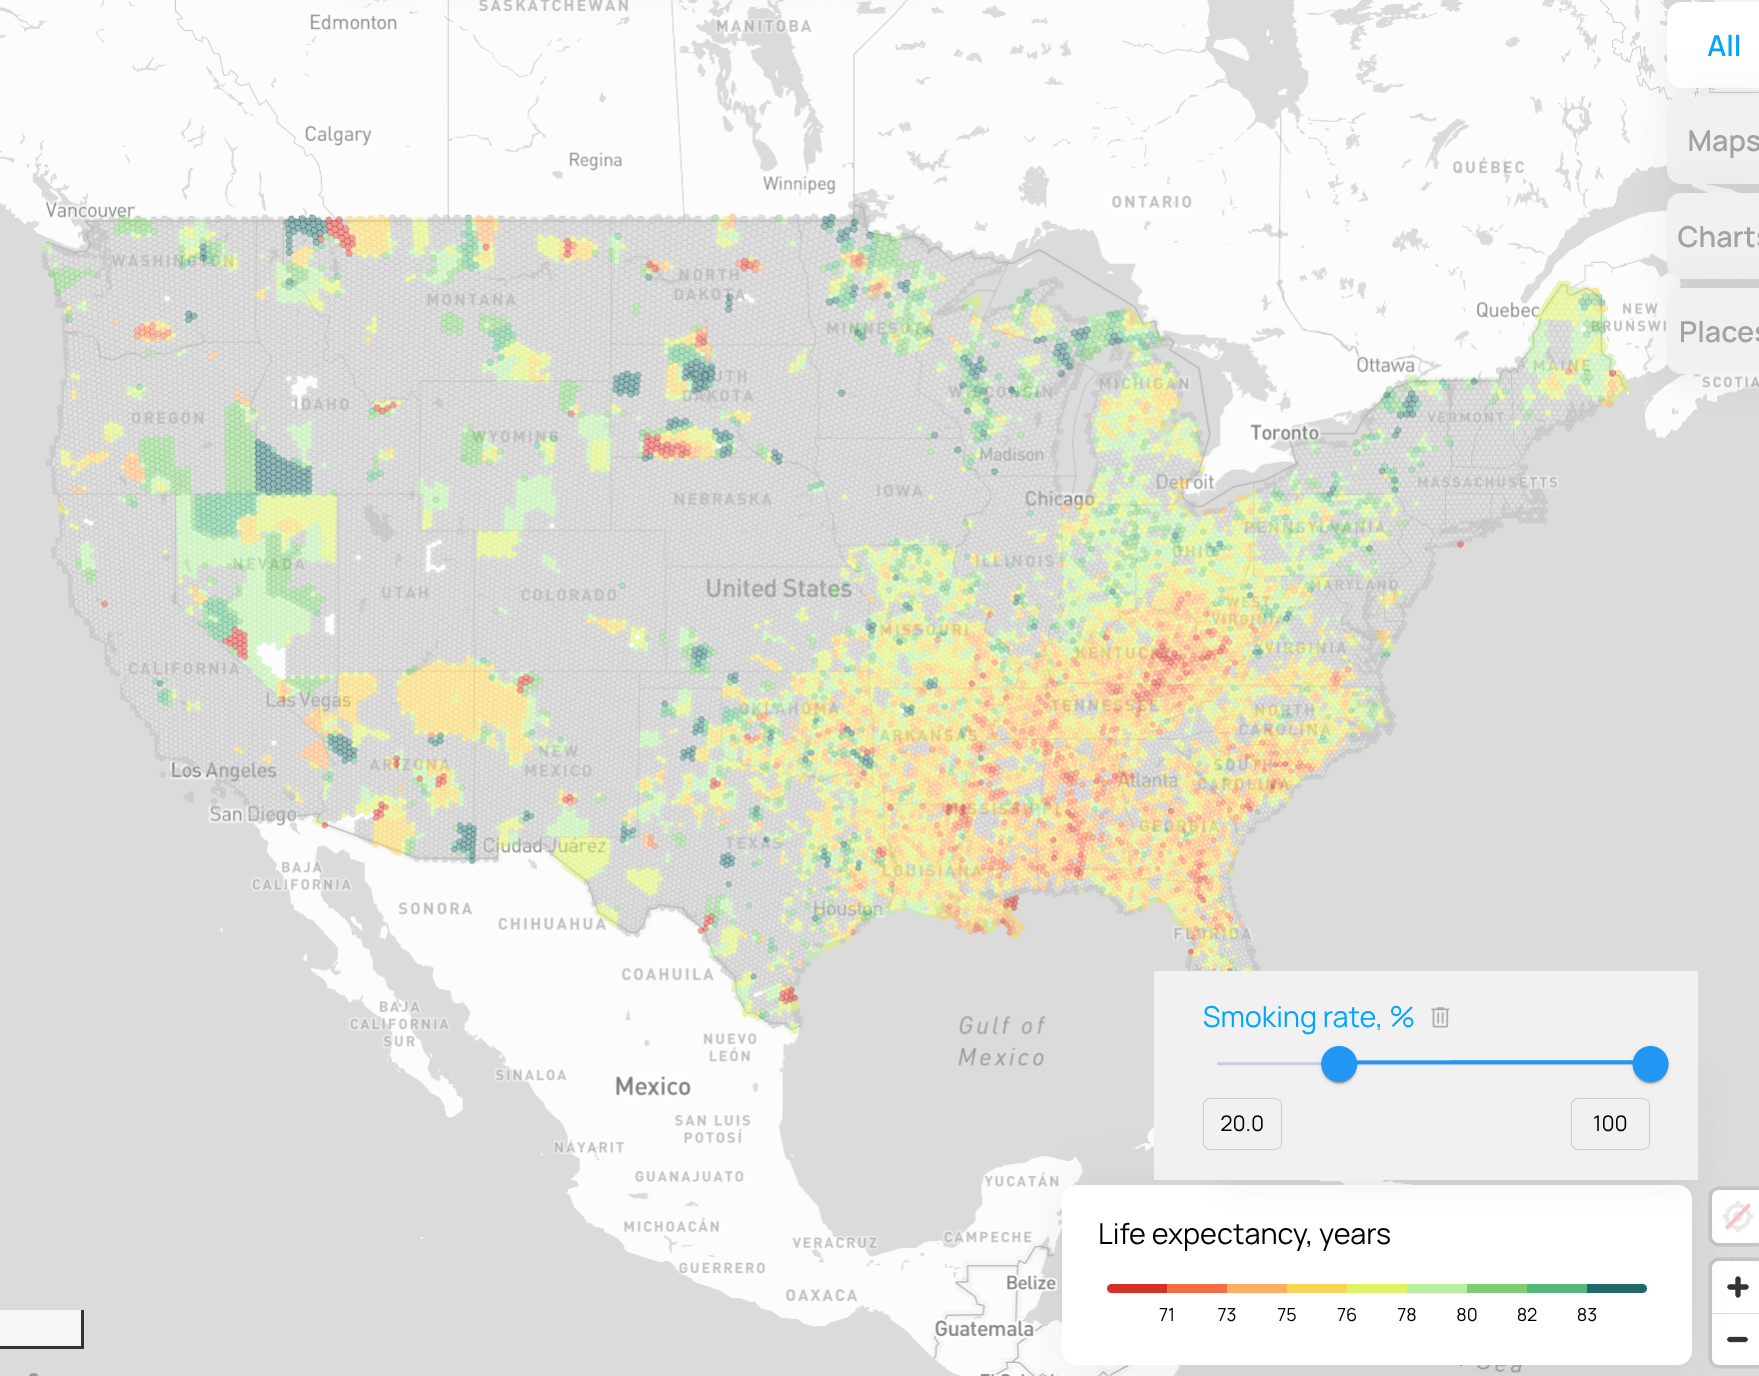
Smoking, Drinking and Life Expectancy: The Geography of Longevity in the US
How smoking and binge drinking line up with life expectancy across US states and counties, how much income and education explain, and where the outliers are.
Read more

Still searching for the right place?
Use Map AI to explore, compare, and find the best fit - all with detailed insights and smart reports on any neighborhood.


