Still searching for the right place?

Use Map AI to explore, compare, and find the best fit - all with detailed insights and smart reports on any neighborhood.

Start free trial

How Map AI Measures Traffic: AADT, Traffic Intensity and VMT Explained
Unhealthy habits prevalence by states

November 9, 2026

8 min to read

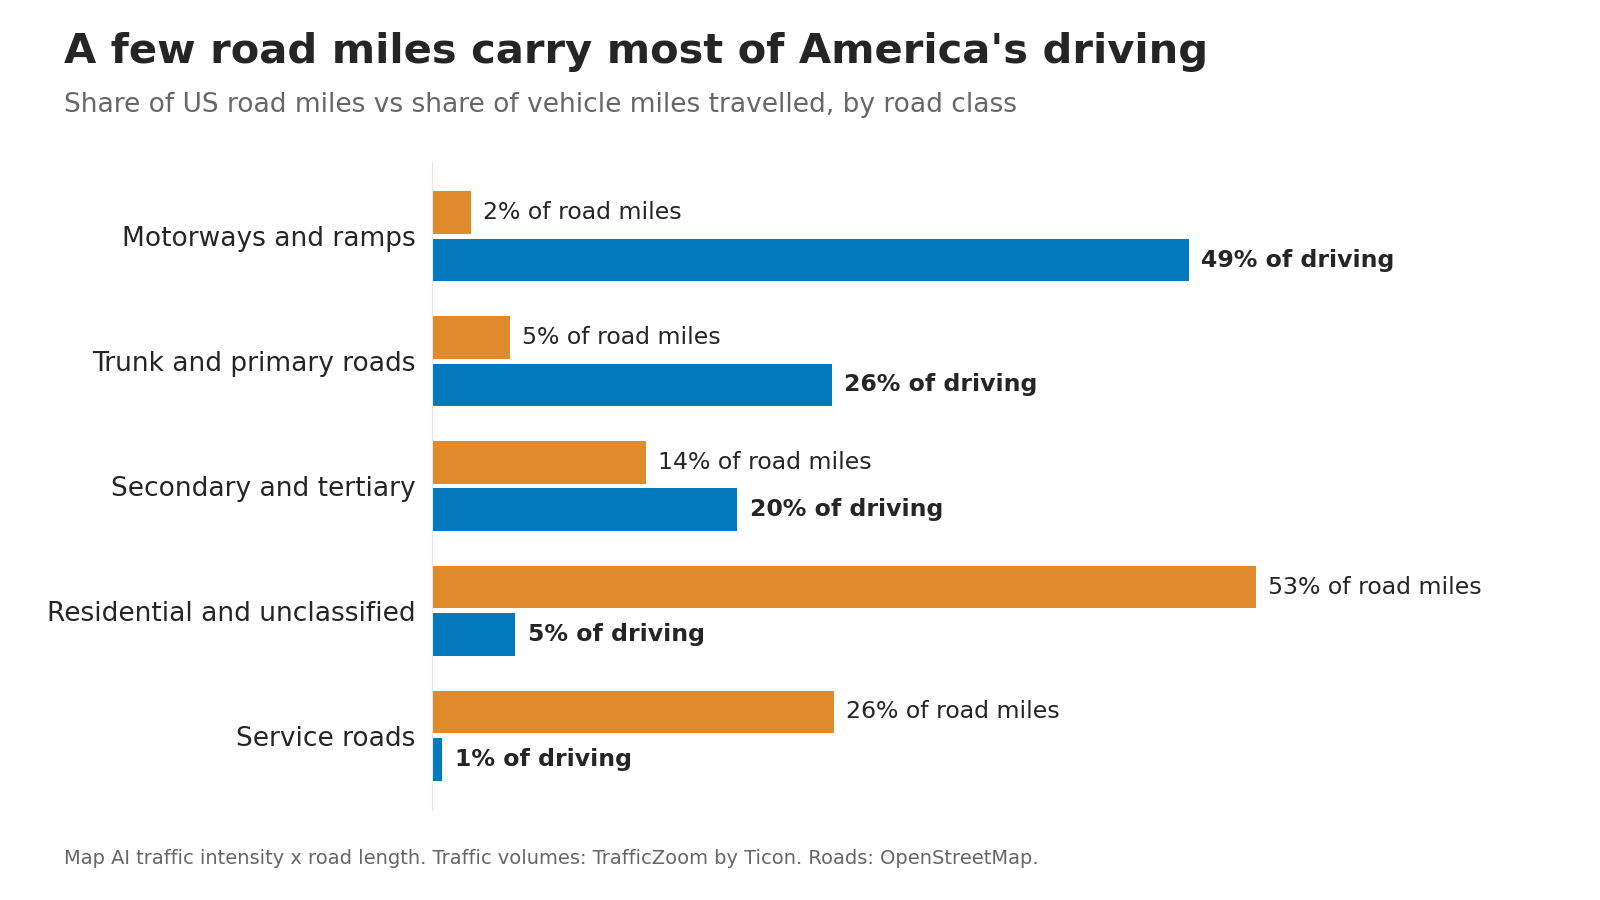
Motorways make up 1.9% of US road miles yet carry 46% of all the driving Map AI counts. Residential streets are 43% of the road network and carry less than 5%.

That gap is why one "traffic" number for an area can mislead, and why Map AI reports traffic by road class. Below: what traffic data Map AI has, where it comes from, and the exact formulas behind every traffic figure on the map.

What traffic data Map AI has

  • Traffic volume on every road: annual average daily traffic (AADT) for about 16 million US road segments, from local streets to interstates.
  • The road network: every public road from OpenStreetMap, measured to the meter and sorted into 13 road classes, from motorway to service road.
  • Destination traffic: a live estimate of how many vehicles a day come to a trade area and stay, used in the Map AI sales forecast.

From these Map AI derives traffic intensity (vehicles per day on an average mile of road) and cumulative traffic intensity (vehicle miles travelled per day).

Where the road volumes come from

The per-road volumes come from TrafficZoom, the traffic platform of Ticon, the company Map AI grew out of. Map AI takes TrafficZoom's estimates as they are and does the geography: it places every road into every area you can select and aggregates the numbers. TrafficZoom builds each estimate in four steps:

  1. Ground truth: counts from permanent and portable detectors published by state departments of transportation and the Federal Highway Administration.
  2. Sample: GPS and connected-vehicle traces matched to the road network give a sample count on every segment, including roads with no detector.
  3. Calibration: at each detector, the share of real traffic the sample captures is measured; detectors that disagree sharply with similar neighbours are dropped.
  4. Expansion: for every other segment, that share is interpolated from nearby detectors, weighted by network distance and road similarity. Sample count divided by share gives the segment's volume.

What AADT means

AADT is the number of vehicles passing one point of a road in a year, both directions, divided by 365. A road with an AADT of 20,000 sees 20,000 vehicles on an average day. AADT belongs to one road segment: a county or a 3-mile radius has no AADT of its own, because it holds thousands of roads with very different volumes. That is why Map AI turns segment AADT into two area measures.

Traffic intensity: the exact formula

Traffic intensity (TI) answers one question: on an average mile of this kind of road in this area, how many vehicles pass per day? It is computed separately for each road class, because a motorway and a residential street are not comparable.

TI(c,A)=∑iAADTi×Li∑iLi
TI(c, A)
traffic intensity: vehicles per day on an average mile of class-c road in area A
A
the area: a county, a state, a radius or a drawn polygon
c
a road class, such as motorway, primary or residential
i
each road segment of class c inside A
AADTi
annual average daily traffic on segment i, vehicles per day
Li
length of segment i inside A; roads crossing the boundary are clipped

This is a length-weighted average: a two-mile stretch counts twice as much as a one-mile stretch, so the result means "an average mile", not "an average segment".

From hexagons to counties and states

Map AI computes TI first on a grid of hexagons of about 2 square miles each (H3 resolution 7) covering the whole country, then builds larger areas from the hexagons with the same weighting:

TI(c,county)=∑hTI(c,h)×L(c,h)∑hL(c,h)
h
each hexagon in the county
L(c, h)
total length of class-c road in hexagon h

Weighting each hexagon by its own road length makes this equal to a length-weighted average over all the road segments in those hexagons. Places, states and the country are built the same way. For a radius, a drive-time area or a drawn polygon, Map AI clips the roads to that shape and applies the first formula directly.

Worked example: Miami-Dade County, Florida

Road classRoad milesTI, vehicles per day
Motorway30761,049
Trunk21719,676
Primary45519,497
Secondary65511,195
Tertiary1,2873,709
Unclassified223753
Residential5,690368
Service4,56085

Ramps (the _link classes) are left out of the table for space but included in every calculation.

An average motorway mile in Miami-Dade carries 166 times the traffic of an average residential mile. Any single number for the county has to decide how to combine these rows.

Combining road classes: highways and local streets

For one figure across several classes, Map AI applies the same length weighting once more:

TI(g,A)=∑c∈gTI(c,A)×L(c,A)∑c∈gL(c,A)
g
a group of road classes (below)
L(c, A)
total length of class-c road in area A
  • Highways: motorways and trunk roads with their ramps.
  • Other streets: primary, secondary, tertiary, residential and unclassified roads with their ramps.
  • All public roads: both groups. Service roads, which in OpenStreetMap are mostly driveways, alleys and parking aisles, are left out.

Miami-Dade gets 34,197 vehicles a day on an average highway mile, 2,790 on other streets, and 5,337 across all public roads. Local streets dominate the length, so they pull the all-roads figure down, which is a fair picture of an average mile of road there.

Cumulative traffic intensity: vehicle miles travelled

Traffic intensity describes a typical road. Cumulative traffic intensity describes the whole area: the total distance driven on its roads in a day, in vehicle miles travelled (VMT). One car driving one mile is one vehicle mile.

VMT(A)=∑cTI(c,A)×L(c,A)=∑iAADTi×Li
VMT(A)
vehicle miles travelled per day on all roads in area A
c, i
every road class, and every road segment, in A
L
road length, here in miles

A half-mile segment with an AADT of 10,000 adds 5,000 vehicle miles a day. Miami-Dade's roads carry about 48.9 million vehicle miles a day, 17.9 per resident. Its 307 miles of motorway, 2.2% of the road length, carry 38% of that driving; residential streets, 42% of the length, carry 4%.

The national picture

Road classShare of US road milesTI, vehicles per day
Motorway1.9%23,406
Trunk1.7%6,159
Primary3.2%4,518
Secondary5.1%2,455
Tertiary8.6%765
Residential43.5%105
Unclassified9.5%66
Service25.8%25

An average motorway mile in Miami-Dade carries 2.6 times the national motorway average, and an average residential mile 3.5 times the national residential average. Dense metros load more traffic onto every class of road, not only their freeways, so per-class traffic intensity shows how busy a place is better than road length or population alone.

Destination traffic: who comes to stay

For a business, passing cars are only part of the story. The Map AI sales forecast also asks TrafficZoom how many vehicles a day enter a trade area and stay, rather than drive through. TrafficZoom takes every road crossing the trade area's boundary, splits it into inbound and outbound directions, and spreads each road's AADT over the 24 hours of the day:

D=∑t:net(t)>0net(t),net(t)=in(t)−out(t)
D
destination traffic, vehicles per day
t
hour of the day, 0 to 23
in(t), out(t)
vehicles crossing the boundary into and out of the trade area in hour t

Through traffic enters and leaves within about the same hour and largely cancels out. In the hours when more vehicles arrive than leave, the area is filling with people who came to be there; summing those hours estimates daily visits by car. Summing the whole day would come out near zero for any area that empties again by night.

AADT, traffic intensity or VMT: which to use

MeasureWhat it tells youUse it for
AADTVehicles a day on one road segmentA specific site: how many cars pass the storefront
Traffic intensityVehicles a day on an average mile of one road class in an areaComparing how busy roads are across areas of any size
VMTTotal miles driven in an area per day; grows with area sizeComparing total driving activity of equal-size areas

Traffic intensity is an average, so 2,790 vehicles a day on Miami-Dade's local streets does not mean any one street carries 2,790. For a site decision, check the AADT of the road itself in TrafficZoom. As a rule of thumb from Ticon's practical guide to reading traffic count data for retail site selection, an AADT above 10,000 is generally considered acceptable for retail, and above 4,000 can work in some cases. All of these volumes are modelled estimates calibrated against detector counts, tighter near a detector than far from one.

Other traffic-related data on Map AI

From the US Census Bureau's American Community Survey, Map AI also maps car ownership and how residents get to work:

  • Households by number of vehicles: none, one, two, three, four or more.
  • Commute time: median one-way travel time to work, and its distribution.
  • Commute mode: car, public transit, walking, bicycle, motorcycle, taxi or working from home.
  • Departure time to work: when residents leave home, which shapes the morning peak.

Road density (miles of road per square mile) comes from the same OpenStreetMap network used above.

See traffic for any US area. Pick a county or draw a radius and check traffic intensity by road class next to population and income.

Open the traffic map

For how total US driving has moved against commuting since 2009, see US traffic volume vs commute time.

Sources: road segment traffic volumes from TrafficZoom by Ticon; road network from OpenStreetMap; vehicles and commuting from the US Census Bureau American Community Survey; retail AADT thresholds from Ticon's guide to reading traffic count data; aggregation, traffic intensity and VMT by Map AI.

LinkExplore demographics
Open map

Retirement-friendly

or dominated by young professionals.

Understanding factors like age demographics, neighborhood income, crime rates, and education ranking allows you to feel the vibe of the area more deeply. With Map AI, it’s a breeze to dig into the demographics of any area!

Open map

Instead of manually compiling data from multiple sources, our platform provides real-time insights, saving you time and effort while delivering accurate and actionable information.

Here’s how it works:

1. Launch the platform in your browser.
2. Find the location you’re interested in, by entering an address on the left.
3. Choose the level of data granularity – 1 mi, 5 mi, county or a state.
4. In the menu bar on the right, go to the "Charts" section and select "Population".
5. Click on the neighborhood you’re curious about to view the data.

And voilà!

An interactive map pops up, layered with data on age groups, income brackets, education levels, and even population density.

It’s like having a real estate crystal ball! Whether you’re prioritizing schools, nightlife, or a specific community vibe, Map AI helps you match your lifestyle to the perfect spot. No more guessing or endless Googling—just actionable insights in a few clicks.

Ready to explore? Head to https://interactive-map-ai.com/ and start mapping your future neighborhood today!

Explore demographics

Map AI makes exploring demographics easy with its interactive, user-friendly platform. Offering detailed maps and customizable filters, Map AI lets you visualize key demographic data such as age distribution, population density by county, by zip and less, median household income map, and family structures across different neighborhoods. You can access real-time data to make more informed decisions about where to live based on the community that best matches your needs and lifestyle.

Open map

By using Map AI, you’ll save time and gain a deeper understanding of your potential new home, ensuring you choose the perfect neighborhood for your future.

Check my neighborhood

Here’s why school rankings matter and how Map AI can help you make the best choice.

Why school rankings matter1. Property Value Impact
Homes located in areas with top-rated schools tend to have higher property values and greater potential for long-term appreciation. School quality is a key factor that many homebuyers consider, even if they don’t have children, because it signals a desirable neighborhood with solid community investment.2. Better Educational Opportunities
For families, the proximity to high-ranking schools can be a major deciding factor. Good schools provide better educational opportunities for children, which can translate into future success. Access to quality education is often viewed as a key benefit of living in certain neighborhoods.3. Community Environment
A strong school system often attracts young families, creating a vibrant, family-friendly community. This can lead to a positive social environment with access to various community activities, events, and local organizations.

How Map AI makes comparing school districts simple

Map AI simplifies the process of comparing school districts by offering interactive maps that display school rankings across different neighborhoods.

With just a few clicks, you can visualize how schools in a specific area stack up against each other, compare performance ratings, and see reviews from local residents.

Open map

By using Map AI, you can make informed decisions about where to buy, ensuring that the neighborhood not only fits your lifestyle but also provides access to the best educational opportunities. Whether you're focused on top-performing schools or simply want to know how a school compares in the area, Map AI makes this data easily accessible and actionable.

Incorporating school rankings into your property search is easy when you have the right tools. With Map AI, you can confidently select a neighborhood that provides excellent education for your children and enhances your home’s long-term value.

Open map

For a comprehensive, data-driven approach to analyze a neighborhood, Map AI is the tool you can't afford to miss.

Compare neighborhoods

How Map AI makes сrime heatmaps easy to use

Map AI takes the power of crime heatmaps to the next level with its user-friendly platform. With just a few clicks, you can explore crime rates by neighborhood that display real-time crime data across America. Map AI’s intuitive interface allows you to customize filters, adjusting the map based on the type of crime you're concerned about, such as violent crimes or property thefts.

You can also zoom in on specific areas to see localized crime patterns, giving you a more detailed view of safety at a granular level. The easy-to-read heatmap visuals make it simple to compare areas, helping you narrow down the safest areas to live in with confidence.

By using Map AI, you get access to accurate, real-time crime data in an easy-to-understand format, making it a must-have tool in your homebuying journey. With Map AI you can make informed decisions that prioritize your safety and peace of mind.

Let us help guide you to the safest places for your next home.

Then select “Filters” from the menu on the right side, choose "Housing" – “Median gross rent” / “ Median home value”, and set your budget.

The map highlights these towns in green, showing median home prices and rental rates.

Zoom in to explore schools, parks, and shopping options—everything a homebuyer needs to decide. Forget endless searches; Map AI puts affordability and convenience on one screen. Check it out at https://interactive-map-ai.com and start planning your move today!

Still searching for the right place?

Use Map AI to explore, compare, and find the best fit - all with detailed insights and smart reports on any neighborhood.

Start free trial