
Still searching for the right place?
Use Map AI to explore, compare, and find the best fit - all with detailed insights and smart reports on any neighborhood.

Hamilton County, IN crime rate data

November 12, 2025

3 min to read
Hamilton County crime rate
Hamilton County, IN recorded 2,032 offenses per 100,000 residents in 2022, based on reports from eight police agencies in the county.
That is about 46% below the US figure (3,761). We do not compare it with an Indiana average, because a large share of Indiana's population lives in counties with incomplete NIBRS reporting, so the statewide figure understates crime in Indiana.
Crimes by type
The most common offenses in Hamilton County in 2022 were theft (3,056), assault (1,478) and fraud (860).
Other offenses reported in 2022:
- Vandalism: 649
- Burglary: 296
- Motor vehicle theft: 220
- Counterfeiting and forgery: 186
- Rape: 167
- Kidnapping: 140
- Robbery: 42
- Murder: 7
Violent offenses (assault, robbery, rape, kidnapping and murder) made up about 26% of the total, and property offenses (theft, vandalism, burglary and motor vehicle theft) about 59%.
Crime rate trend
Hamilton County's rate rose about 38%, from 1,466 per 100,000 in 2020 to 2,016 in 2021, then stayed essentially flat at 2,032 in 2022. The same eight police agencies reported in all three years, so these are like-for-like changes.
We do not compare these years with state or US trends, because NIBRS participation grew quickly across the country between 2020 and 2022.
Hamilton County: what stands out
The largest like-for-like change by type was rape, which fell about 26% between 2021 and 2022, from 227 to 167 reports. Theft alone accounted for about 43% of the offenses counted in 2022, roughly 874 reports per 100,000 residents.
See more
About this number: the rate counts victim-level offenses reported to the FBI's National Incident-Based Reporting System (NIBRS) in 12 offense groups, per 100,000 residents. Assault includes aggravated assault, simple assault and intimidation, which is why it often outnumbers theft; theft includes shoplifting and theft from vehicles. The measure is broader than the FBI's violent and property crime rate, and state and US figures only include agencies that reported, so they are incomplete too. 2022 is the latest year in Map AI's crime data.
Source: FBI NIBRS 2020-2022, compiled by Map AI. For demographics, income and housing, see the Hamilton County, IN overview on Map AI.

Retirement-friendly

or dominated by young professionals.

Understanding factors like age demographics, neighborhood income, crime rates, and education ranking allows you to feel the vibe of the area more deeply. With Map AI, it’s a breeze to dig into the demographics of any area!
Open mapInstead of manually compiling data from multiple sources, our platform provides real-time insights, saving you time and effort while delivering accurate and actionable information.
Here’s how it works:
1. Launch the platform in your browser.
2. Find the location you’re interested in, by entering an address on the left.
3. Choose the level of data granularity – 1 mi, 5 mi, county or a state.
4. In the menu bar on the right, go to the "Charts" section and select "Population".
5. Click on the neighborhood you’re curious about to view the data.
And voilà!
An interactive map pops up, layered with data on age groups, income brackets, education levels, and even population density.

It’s like having a real estate crystal ball! Whether you’re prioritizing schools, nightlife, or a specific community vibe, Map AI helps you match your lifestyle to the perfect spot. No more guessing or endless Googling—just actionable insights in a few clicks.
Ready to explore? Head to https://interactive-map-ai.com/ and start mapping your future neighborhood today!
Map AI makes exploring demographics easy with its interactive, user-friendly platform. Offering detailed maps and customizable filters, Map AI lets you visualize key demographic data such as age distribution, population density by county, by zip and less, median household income map, and family structures across different neighborhoods. You can access real-time data to make more informed decisions about where to live based on the community that best matches your needs and lifestyle.
Open mapBy using Map AI, you’ll save time and gain a deeper understanding of your potential new home, ensuring you choose the perfect neighborhood for your future.
Check my neighborhoodHere’s why school rankings matter and how Map AI can help you make the best choice.
Why school rankings matter1. Property Value Impact
Homes located in areas with top-rated schools tend to have higher property values and greater potential for long-term appreciation. School quality is a key factor that many homebuyers consider, even if they don’t have children, because it signals a desirable neighborhood with solid community investment.2. Better Educational Opportunities
For families, the proximity to high-ranking schools can be a major deciding factor. Good schools provide better educational opportunities for children, which can translate into future success. Access to quality education is often viewed as a key benefit of living in certain neighborhoods.3. Community Environment
A strong school system often attracts young families, creating a vibrant, family-friendly community. This can lead to a positive social environment with access to various community activities, events, and local organizations.
How Map AI makes comparing school districts simple
Map AI simplifies the process of comparing school districts by offering interactive maps that display school rankings across different neighborhoods.

With just a few clicks, you can visualize how schools in a specific area stack up against each other, compare performance ratings, and see reviews from local residents.
Open mapBy using Map AI, you can make informed decisions about where to buy, ensuring that the neighborhood not only fits your lifestyle but also provides access to the best educational opportunities. Whether you're focused on top-performing schools or simply want to know how a school compares in the area, Map AI makes this data easily accessible and actionable.
Incorporating school rankings into your property search is easy when you have the right tools. With Map AI, you can confidently select a neighborhood that provides excellent education for your children and enhances your home’s long-term value.
For a comprehensive, data-driven approach to analyze a neighborhood, Map AI is the tool you can't afford to miss.
Compare neighborhoodsHow Map AI makes сrime heatmaps easy to use
Map AI takes the power of crime heatmaps to the next level with its user-friendly platform. With just a few clicks, you can explore crime rates by neighborhood that display real-time crime data across America. Map AI’s intuitive interface allows you to customize filters, adjusting the map based on the type of crime you're concerned about, such as violent crimes or property thefts.
You can also zoom in on specific areas to see localized crime patterns, giving you a more detailed view of safety at a granular level. The easy-to-read heatmap visuals make it simple to compare areas, helping you narrow down the safest areas to live in with confidence.
By using Map AI, you get access to accurate, real-time crime data in an easy-to-understand format, making it a must-have tool in your homebuying journey. With Map AI you can make informed decisions that prioritize your safety and peace of mind.
Let us help guide you to the safest places for your next home.

Then select “Filters” from the menu on the right side, choose "Housing" – “Median gross rent” / “ Median home value”, and set your budget.

The map highlights these towns in green, showing median home prices and rental rates.

Zoom in to explore schools, parks, and shopping options—everything a homebuyer needs to decide. Forget endless searches; Map AI puts affordability and convenience on one screen. Check it out at https://interactive-map-ai.com and start planning your move today!
Just for you
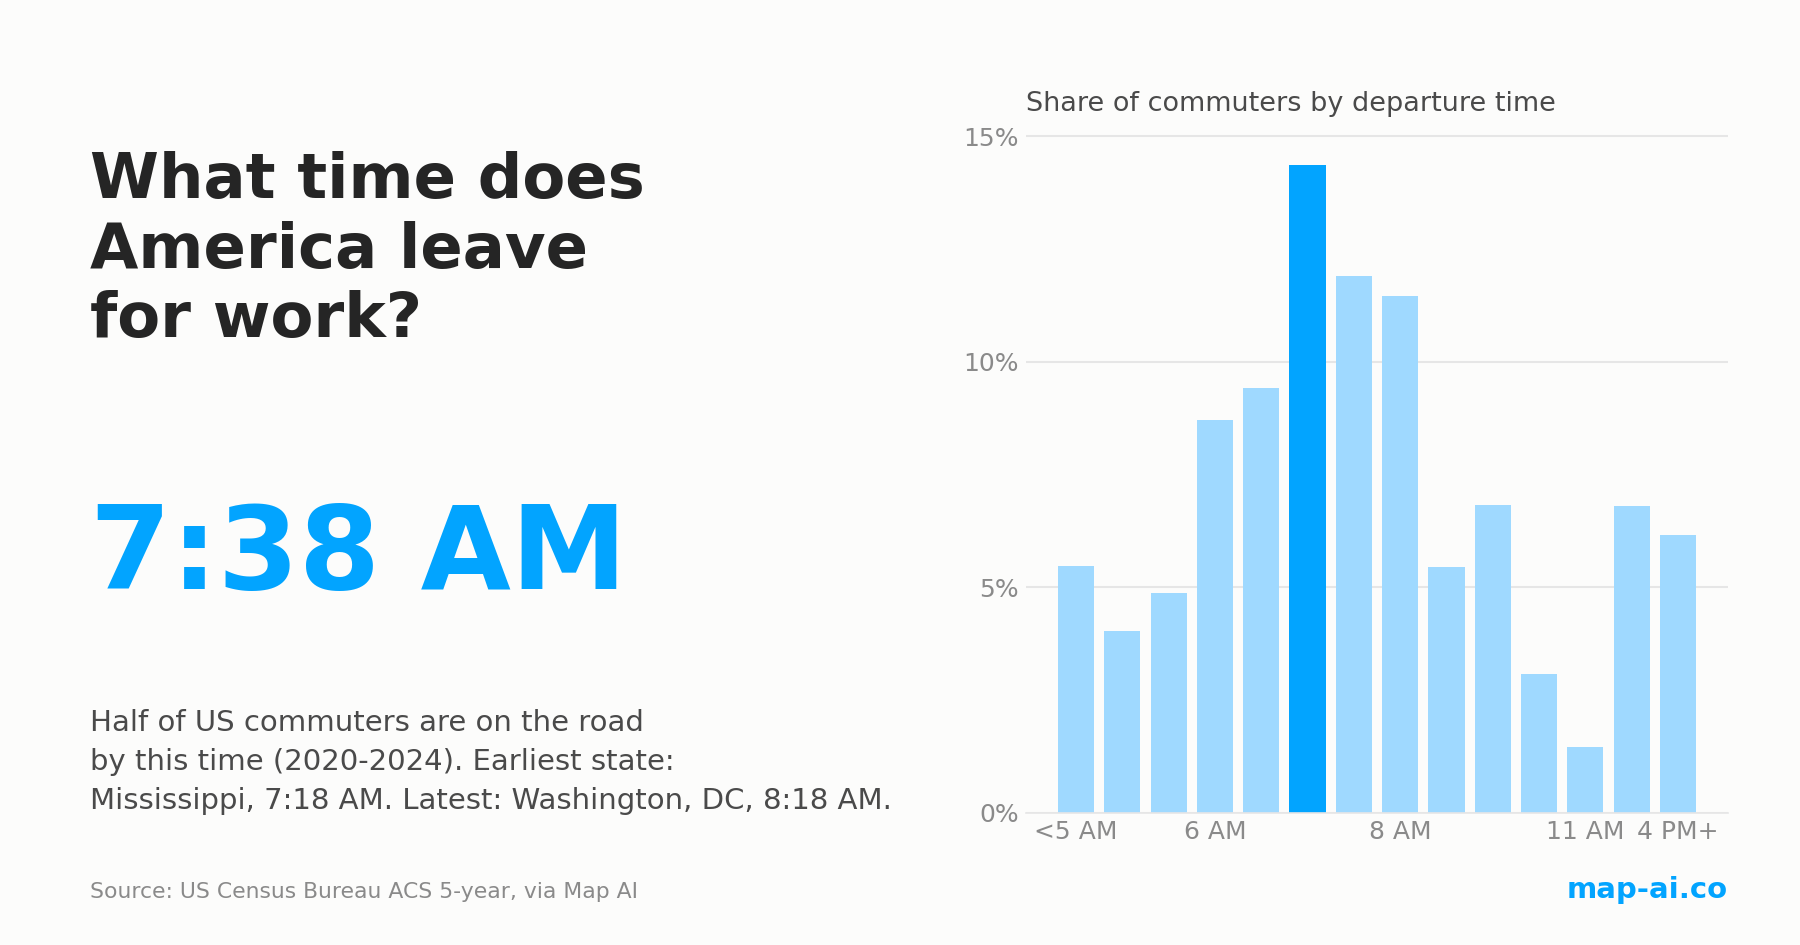
What Time Do Americans Leave for Work? Commute Start Times by State and County
Half of US commuters are on the road by 7:38 AM, the same as in 2009. The morning still changed: here is where America starts earliest and latest.
Read more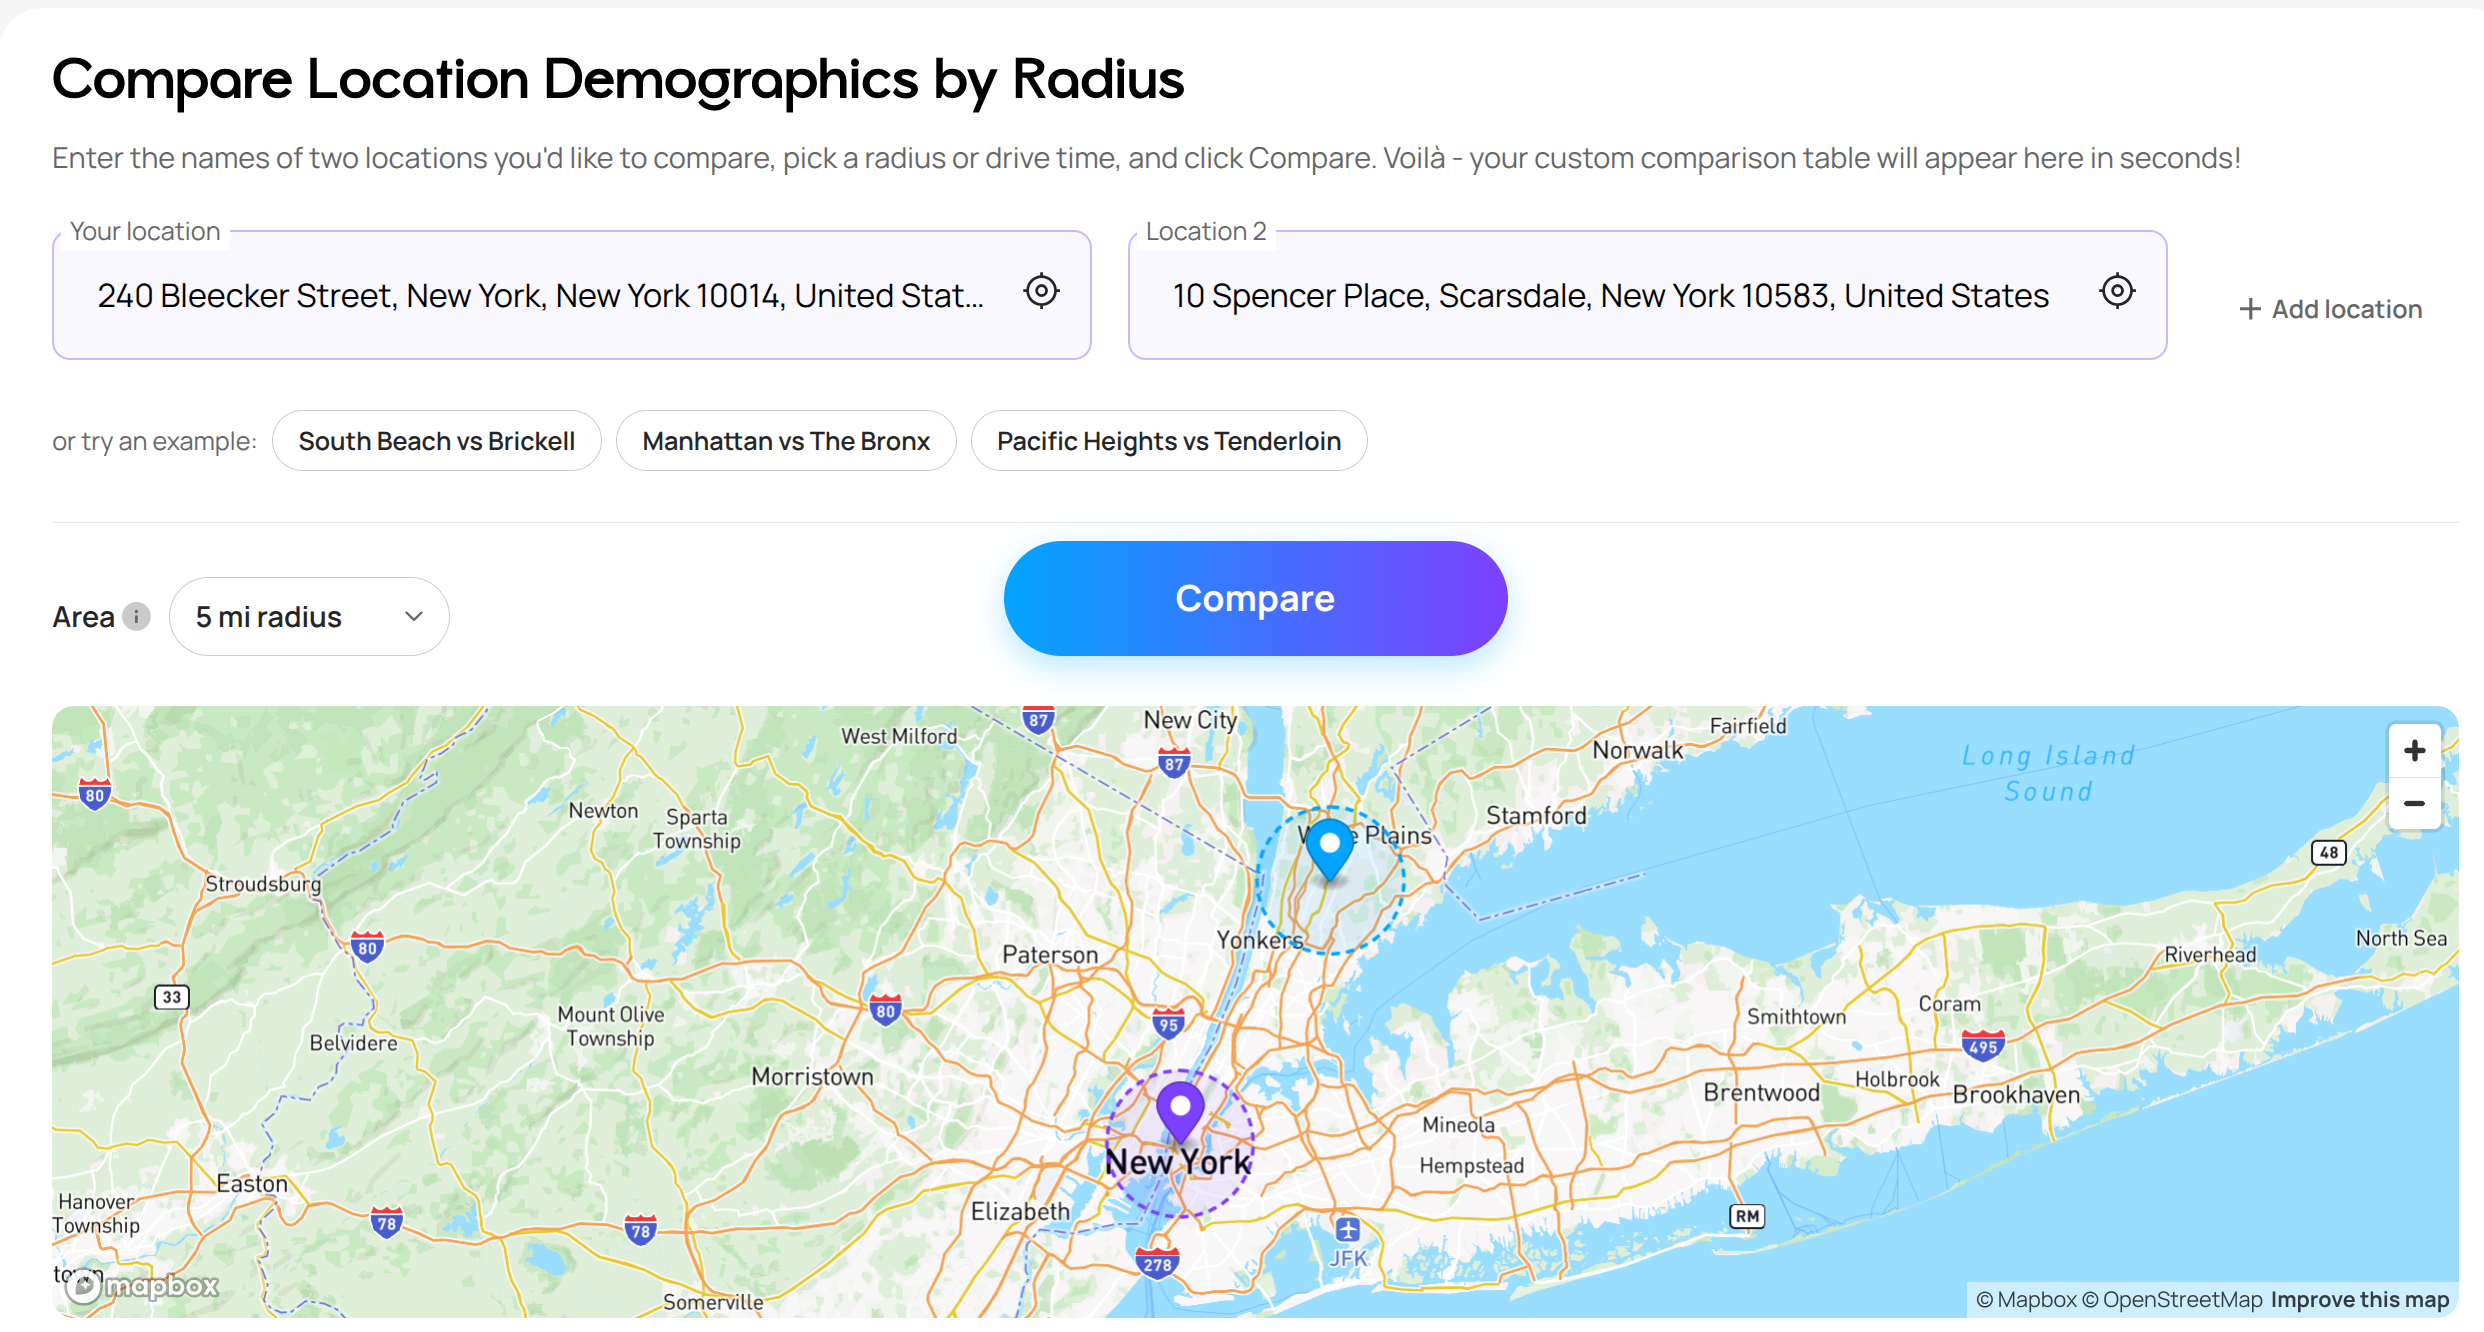
Still searching for the right place?
Use Map AI to explore, compare, and find the best fit - all with detailed insights and smart reports on any neighborhood.


