
Still searching for the right place?
Use Map AI to explore, compare, and find the best fit - all with detailed insights and smart reports on any neighborhood.

High-Income States That Are Losing Momentum


August 31, 2026

9 min to read
Maryland has the second-highest median household income in the country, $101,971 in 2023, up from $85,294 in 2019. That is a 19.55% raise on paper. Adjusted for inflation, the typical Maryland household gained $264 of purchasing power over four years, about $66 a year.
Maryland is not an outlier. Of the 21 states and districts that entered 2019 above the national median income, 15 grew slower than the country did over the next four years. High income is a level. Momentum is a direction. They come apart more often than a ranking table lets on.
First, the inflation question, because everything below depends on it
Map AI's median household income series comes from the US Census Bureau's American Community Survey, and it is not adjusted for inflation across years.
This trips people up because of a labelling quirk. Census publishes these tables under headings like "in 2023 inflation-adjusted dollars," which sounds like the adjusting has been done for you. It has not, at least not in the way you need. That adjustment happens inside a single release: it brings the earlier survey responses in that release up to the final year's price level. It does nothing to make the 2019 release comparable to the 2023 release.
So $62,527 is in 2019 dollars and $78,145 is in 2023 dollars. Putting them side by side and calling the difference a 24.98% raise compares two different currencies.
The break-even line
To make them comparable you need one number: how much prices rose in between. The standard measure is the BLS Consumer Price Index for All Urban Consumers, whose annual average went from 255.657 in 2019 to 304.702 in 2023.
304.702 / 255.657 = 1.1918
Prices rose 19.18%. That is the break-even line for this whole article. A state needed nominal income growth of +19.18% between 2019 and 2023 just to leave its households exactly where they started.
The arithmetic, once
Take the national figures and divide the later one by 1.1918:
$78,145 (2023 dollars) / 1.1918 = $65,567 in 2019 dollars
Compare that to the $62,527 households actually had in 2019 and you get the real gain: +4.86%, or $3,040 of 2019 purchasing power spread over four years. Roughly $760 a year. That is the honest version of "US median household income rose 24.98%."
The shortcut, and where it misleads
The quick mental version is to subtract: 24.98% growth minus 19.18% inflation equals 5.8 points of real gain. The true answer is 4.86%.
Subtraction always flatters the result slightly, because growth compounds on top of the higher price level rather than adding to it. The error is small at these magnitudes, under a point, and it always runs the same direction. Use subtraction for a quick read, division when the number matters. Throughout this article, "real" means divided, not subtracted.
The 15 high-income states that fell behind the country
Everything below is a state whose 2019 median household income was above the national $62,527 and whose nominal growth to 2023 came in under the national 24.98%. Sorted by real change, worst first.
| State | 2019 income | Rank 2019 | Nominal | Real | Real gain | Rank 2023 |
|---|---|---|---|---|---|---|
| Wyoming | $64,723 | 20 | +15.62% | -2.99% | -$1,935 | 28 |
| Alaska | $77,952 | 7 | +15.89% | -2.76% | -$2,155 | 13 |
| North Dakota | $65,386 | 19 | +16.33% | -2.40% | -$1,568 | 24 |
| Maryland | $85,294 | 2 | +19.55% | +0.31% | +$264 | 2 |
| Hawaii | $81,741 | 4 | +20.30% | +0.93% | +$763 | 5 |
| Connecticut | $79,075 | 6 | +20.60% | +1.19% | +$938 | 8 |
| New Jersey | $83,185 | 3 | +21.66% | +2.07% | +$1,726 | 4 |
| Delaware | $68,377 | 16 | +22.11% | +2.45% | +$1,676 | 17 |
| District of Columbia | $87,267 | 1 | +22.87% | +3.09% | +$2,700 | 1 |
| Virginia | $74,291 | 10 | +23.04% | +3.24% | +$2,405 | 12 |
| Minnesota | $71,617 | 14 | +23.41% | +3.55% | +$2,540 | 14 |
| Illinois | $66,470 | 18 | +23.63% | +3.73% | +$2,481 | 18 |
| New York | $68,875 | 15 | +23.69% | +3.78% | +$2,604 | 16 |
| Massachusetts | $81,731 | 5 | +24.19% | +4.20% | +$3,432 | 3 |
| New Hampshire | $76,945 | 8 | +24.86% | +4.76% | +$3,662 | 7 |
| United States | $62,527 | - | +24.98% | +4.86% | +$3,040 | - |
Real gain is in 2019 dollars, so it answers a concrete question: how much more could this state's middle household actually buy in 2023 than in 2019?
Nine of the fifteen are in the Northeast or Mid-Atlantic. Six of the fifteen lost population outright over 2019 to 2024: Alaska, Hawaii, Connecticut, the District of Columbia, Illinois and New York. Stalled paychecks and departing residents are showing up in the same places, and none of the six appears anywhere near the 10 states with the fastest-growing population.
Three states went backwards
Wyoming, Alaska and North Dakota are the only three places in the country where the median household had less purchasing power in 2023 than in 2019.
Wyoming's median rose from $64,723 to $74,833, which looks like a raise and is a 2.99% cut once prices are accounted for, worth $1,935 in 2019 dollars. Alaska lost $2,155 and North Dakota $1,568.
All three share a profile: small populations, economies where a narrow set of resource industries sets the middle of the income distribution, and a 2019 starting point already above the national median, which leaves less room for the catch-up gains that lifted the Southeast. They are also the three biggest fallers in the national income ranking. Wyoming dropped eight places, from 20th to 28th. Alaska fell from 7th to 13th, North Dakota from 19th to 24th. Wyoming's income page now shows a median about 4% below the national figure, in a state that was comfortably above it four years earlier.
Maryland is the flattest rich state in America
Maryland held rank 2 in 2019 and rank 2 in 2023. Nothing about its position changed, which is exactly the point: it stood still while the country moved 4.86% ahead in real terms.
$264 over four years is close enough to zero that the more useful statement is that Maryland's typical household ended 2023 with the same buying power it had in 2019. The Maryland income statistics page shows the $101,971 headline, and a headline is precisely what hides this. Second place in the nation and a flat real line are entirely compatible facts.
Connecticut and Hawaii are stalling on two fronts
Connecticut gained $938 of real income over four years and lost 3.40% of its population, the steepest population decline of any state. Hawaii gained $763 and lost 0.64%.
These are the two clearest cases of a genuine momentum problem rather than a statistical one. When income growth trails the nation and residents leave, the two feed each other: fewer working-age households, a thinner tax base, and less of the labour-market tightness that pushes wages up. Connecticut still ranks 8th in the country on income level. Levels are lagging indicators.
A ranking can rise while a state falls behind
Massachusetts grew 24.19% and New Hampshire 24.86%, both below the national 24.98%. Both still climbed the table, Massachusetts from 5th to 3rd and New Hampshire from 8th to 7th.
They moved up because the states above them stalled harder. This is the single most misleading thing about income rankings: your position is set by everyone else's trajectory, not your own. New Hampshire and Massachusetts posted the two largest real gains on this list, $3,662 and $3,432, and both are still on this list, because both still trailed the country. Getting a promotion in a shrinking department is not the same as a raise.
National inflation is not local cost of living
The 19.18% break-even is a national average. What a household actually faces is local, and housing is where the two diverge most.
| State | Median home value 2019 to 2023 | Median rent | Nominal income |
|---|---|---|---|
| Wyoming | +37.61% | +13.23% | +15.62% |
| New Jersey | +30.30% | +24.01% | +21.66% |
| Connecticut | +21.48% | +19.34% | +20.60% |
| Hawaii | not shown | +19.86% | +20.30% |
| Maryland | +17.95% | +19.32% | +19.55% |
Two different failure modes sit in that table.
In New Jersey and Wyoming, local housing clearly outran local income. New Jersey's median home value rose 30.30% to $359,215 while its median income rose 21.66%. Wyoming's rose 37.61% against income growth of 15.62%. For those households the squeeze is worse than the national inflation figure implies.
In Maryland, Connecticut and Hawaii, housing costs roughly tracked income. Their problem is not that housing pulled away. It is that nothing moved at all: income, rent and home values all landed within a couple of points of the 19.18% inflation line, which is another way of saying four years produced no change in real circumstances. Hawaii's median home value series is too volatile year to year to quote responsibly, so only rent is shown there.
Who kept their momentum
Six high-income states beat the national rate, and the geography is not subtle.
| State | Nominal | Real | 2023 income | Population 2019 to 2024 |
|---|---|---|---|---|
| Washington | +28.95% | +8.19% | $95,177 | +4.88% |
| Rhode Island | +28.64% | +7.93% | $86,475 | +1.07% |
| Utah | +28.54% | +7.85% | $92,351 | +8.23% |
| California | +28.53% | +7.85% | $96,718 | -0.93% |
| Oregon | +28.43% | +7.76% | $80,923 | +2.55% |
| Colorado | +28.09% | +7.47% | $93,055 | +4.26% |
Five of the six are on the Pacific coast or in the Mountain West. Rhode Island is the lone eastern exception, and it did it with population growth of just 1.07%.
The real-terms spread across high-income states is wider than the nominal numbers suggest: Washington's households gained 8.19% of purchasing power while Wyoming's lost 2.99%, an 11-point gap opened in four years among states that all started above the national median.
What to take from this
Three habits make income data behave.
Check the units first: a Census income figure is in that year's dollars, and the "inflation-adjusted" label refers to the release, not to comparability across releases. Compare against the break-even, not against zero: from 2019 to 2023 that line was +19.18%, and anything below it is a cut. Read levels and trajectories separately, because a state can be second-richest in the country and completely flat, and it can slip against the nation while climbing the leaderboard.
See more
Sources: US Census Bureau, American Community Survey, as processed by Map AI, for all income, home value and rent figures. Inflation adjustment uses the US Bureau of Labor Statistics Consumer Price Index for All Urban Consumers, US city average, all items, annual average, 1982-84=100: 255.657 in 2019 and 304.702 in 2023. Income, home value and rent series run through 2023, the latest available. Population change covers 2019 to 2024.
- Compare median household income across every state on the interactive map
- United States income and wealth
- Maryland, Connecticut and Alaska income statistics
- US Bureau of Labor Statistics, Consumer Price Index, the source of the 2019 and 2023 index values used for every inflation adjustment above
- States with the fastest-growing median household income, the same figures before inflation
- The 10 states with the fastest-growing population
- Richest vs poorest states in America by median household income
- Map AI data sources

Retirement-friendly

or dominated by young professionals.

Understanding factors like age demographics, neighborhood income, crime rates, and education ranking allows you to feel the vibe of the area more deeply. With Map AI, it’s a breeze to dig into the demographics of any area!
Open mapInstead of manually compiling data from multiple sources, our platform provides real-time insights, saving you time and effort while delivering accurate and actionable information.
Here’s how it works:
1. Launch the platform in your browser.
2. Find the location you’re interested in, by entering an address on the left.
3. Choose the level of data granularity – 1 mi, 5 mi, county or a state.
4. In the menu bar on the right, go to the "Charts" section and select "Population".
5. Click on the neighborhood you’re curious about to view the data.
And voilà!
An interactive map pops up, layered with data on age groups, income brackets, education levels, and even population density.

It’s like having a real estate crystal ball! Whether you’re prioritizing schools, nightlife, or a specific community vibe, Map AI helps you match your lifestyle to the perfect spot. No more guessing or endless Googling—just actionable insights in a few clicks.
Ready to explore? Head to https://interactive-map-ai.com/ and start mapping your future neighborhood today!
Map AI makes exploring demographics easy with its interactive, user-friendly platform. Offering detailed maps and customizable filters, Map AI lets you visualize key demographic data such as age distribution, population density by county, by zip and less, median household income map, and family structures across different neighborhoods. You can access real-time data to make more informed decisions about where to live based on the community that best matches your needs and lifestyle.
Open mapBy using Map AI, you’ll save time and gain a deeper understanding of your potential new home, ensuring you choose the perfect neighborhood for your future.
Check my neighborhoodHere’s why school rankings matter and how Map AI can help you make the best choice.
Why school rankings matter1. Property Value Impact
Homes located in areas with top-rated schools tend to have higher property values and greater potential for long-term appreciation. School quality is a key factor that many homebuyers consider, even if they don’t have children, because it signals a desirable neighborhood with solid community investment.2. Better Educational Opportunities
For families, the proximity to high-ranking schools can be a major deciding factor. Good schools provide better educational opportunities for children, which can translate into future success. Access to quality education is often viewed as a key benefit of living in certain neighborhoods.3. Community Environment
A strong school system often attracts young families, creating a vibrant, family-friendly community. This can lead to a positive social environment with access to various community activities, events, and local organizations.
How Map AI makes comparing school districts simple
Map AI simplifies the process of comparing school districts by offering interactive maps that display school rankings across different neighborhoods.

With just a few clicks, you can visualize how schools in a specific area stack up against each other, compare performance ratings, and see reviews from local residents.
Open mapBy using Map AI, you can make informed decisions about where to buy, ensuring that the neighborhood not only fits your lifestyle but also provides access to the best educational opportunities. Whether you're focused on top-performing schools or simply want to know how a school compares in the area, Map AI makes this data easily accessible and actionable.
Incorporating school rankings into your property search is easy when you have the right tools. With Map AI, you can confidently select a neighborhood that provides excellent education for your children and enhances your home’s long-term value.
For a comprehensive, data-driven approach to analyze a neighborhood, Map AI is the tool you can't afford to miss.
Compare neighborhoodsHow Map AI makes сrime heatmaps easy to use
Map AI takes the power of crime heatmaps to the next level with its user-friendly platform. With just a few clicks, you can explore crime rates by neighborhood that display real-time crime data across America. Map AI’s intuitive interface allows you to customize filters, adjusting the map based on the type of crime you're concerned about, such as violent crimes or property thefts.
You can also zoom in on specific areas to see localized crime patterns, giving you a more detailed view of safety at a granular level. The easy-to-read heatmap visuals make it simple to compare areas, helping you narrow down the safest areas to live in with confidence.
By using Map AI, you get access to accurate, real-time crime data in an easy-to-understand format, making it a must-have tool in your homebuying journey. With Map AI you can make informed decisions that prioritize your safety and peace of mind.
Let us help guide you to the safest places for your next home.

Then select “Filters” from the menu on the right side, choose "Housing" – “Median gross rent” / “ Median home value”, and set your budget.

The map highlights these towns in green, showing median home prices and rental rates.

Zoom in to explore schools, parks, and shopping options—everything a homebuyer needs to decide. Forget endless searches; Map AI puts affordability and convenience on one screen. Check it out at https://interactive-map-ai.com and start planning your move today!
Just for you
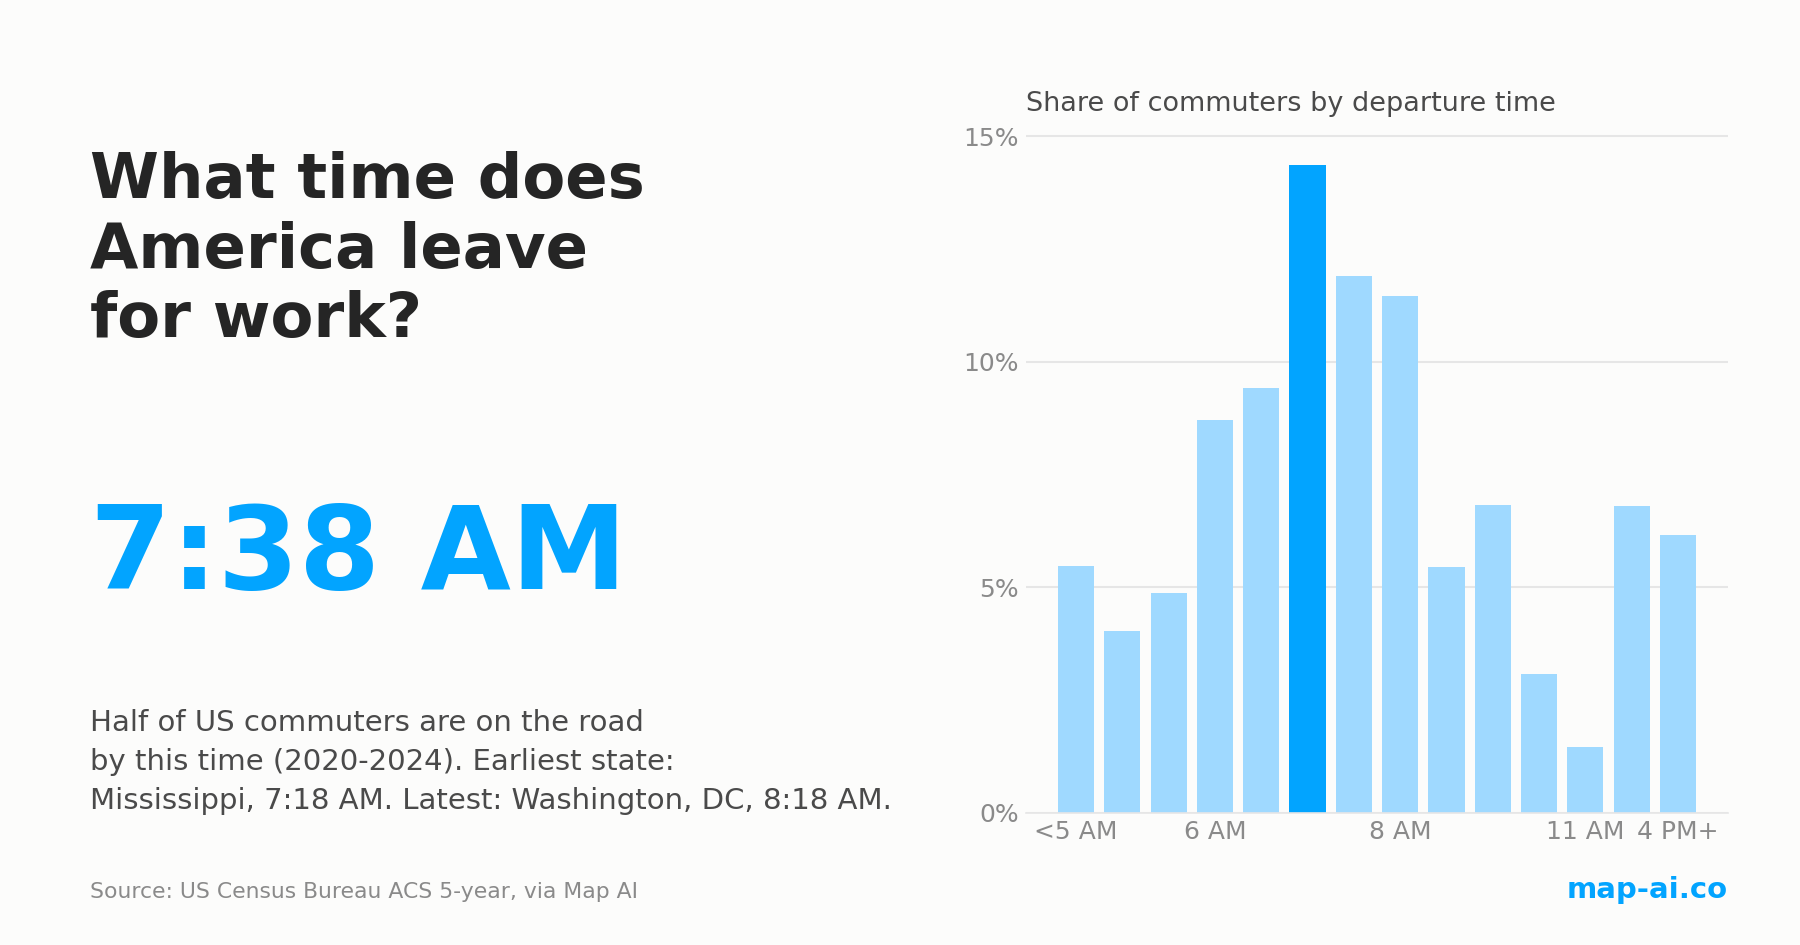
What Time Do Americans Leave for Work? Commute Start Times by State and County
Half of US commuters are on the road by 7:38 AM, the same as in 2009. The morning still changed: here is where America starts earliest and latest.
Read more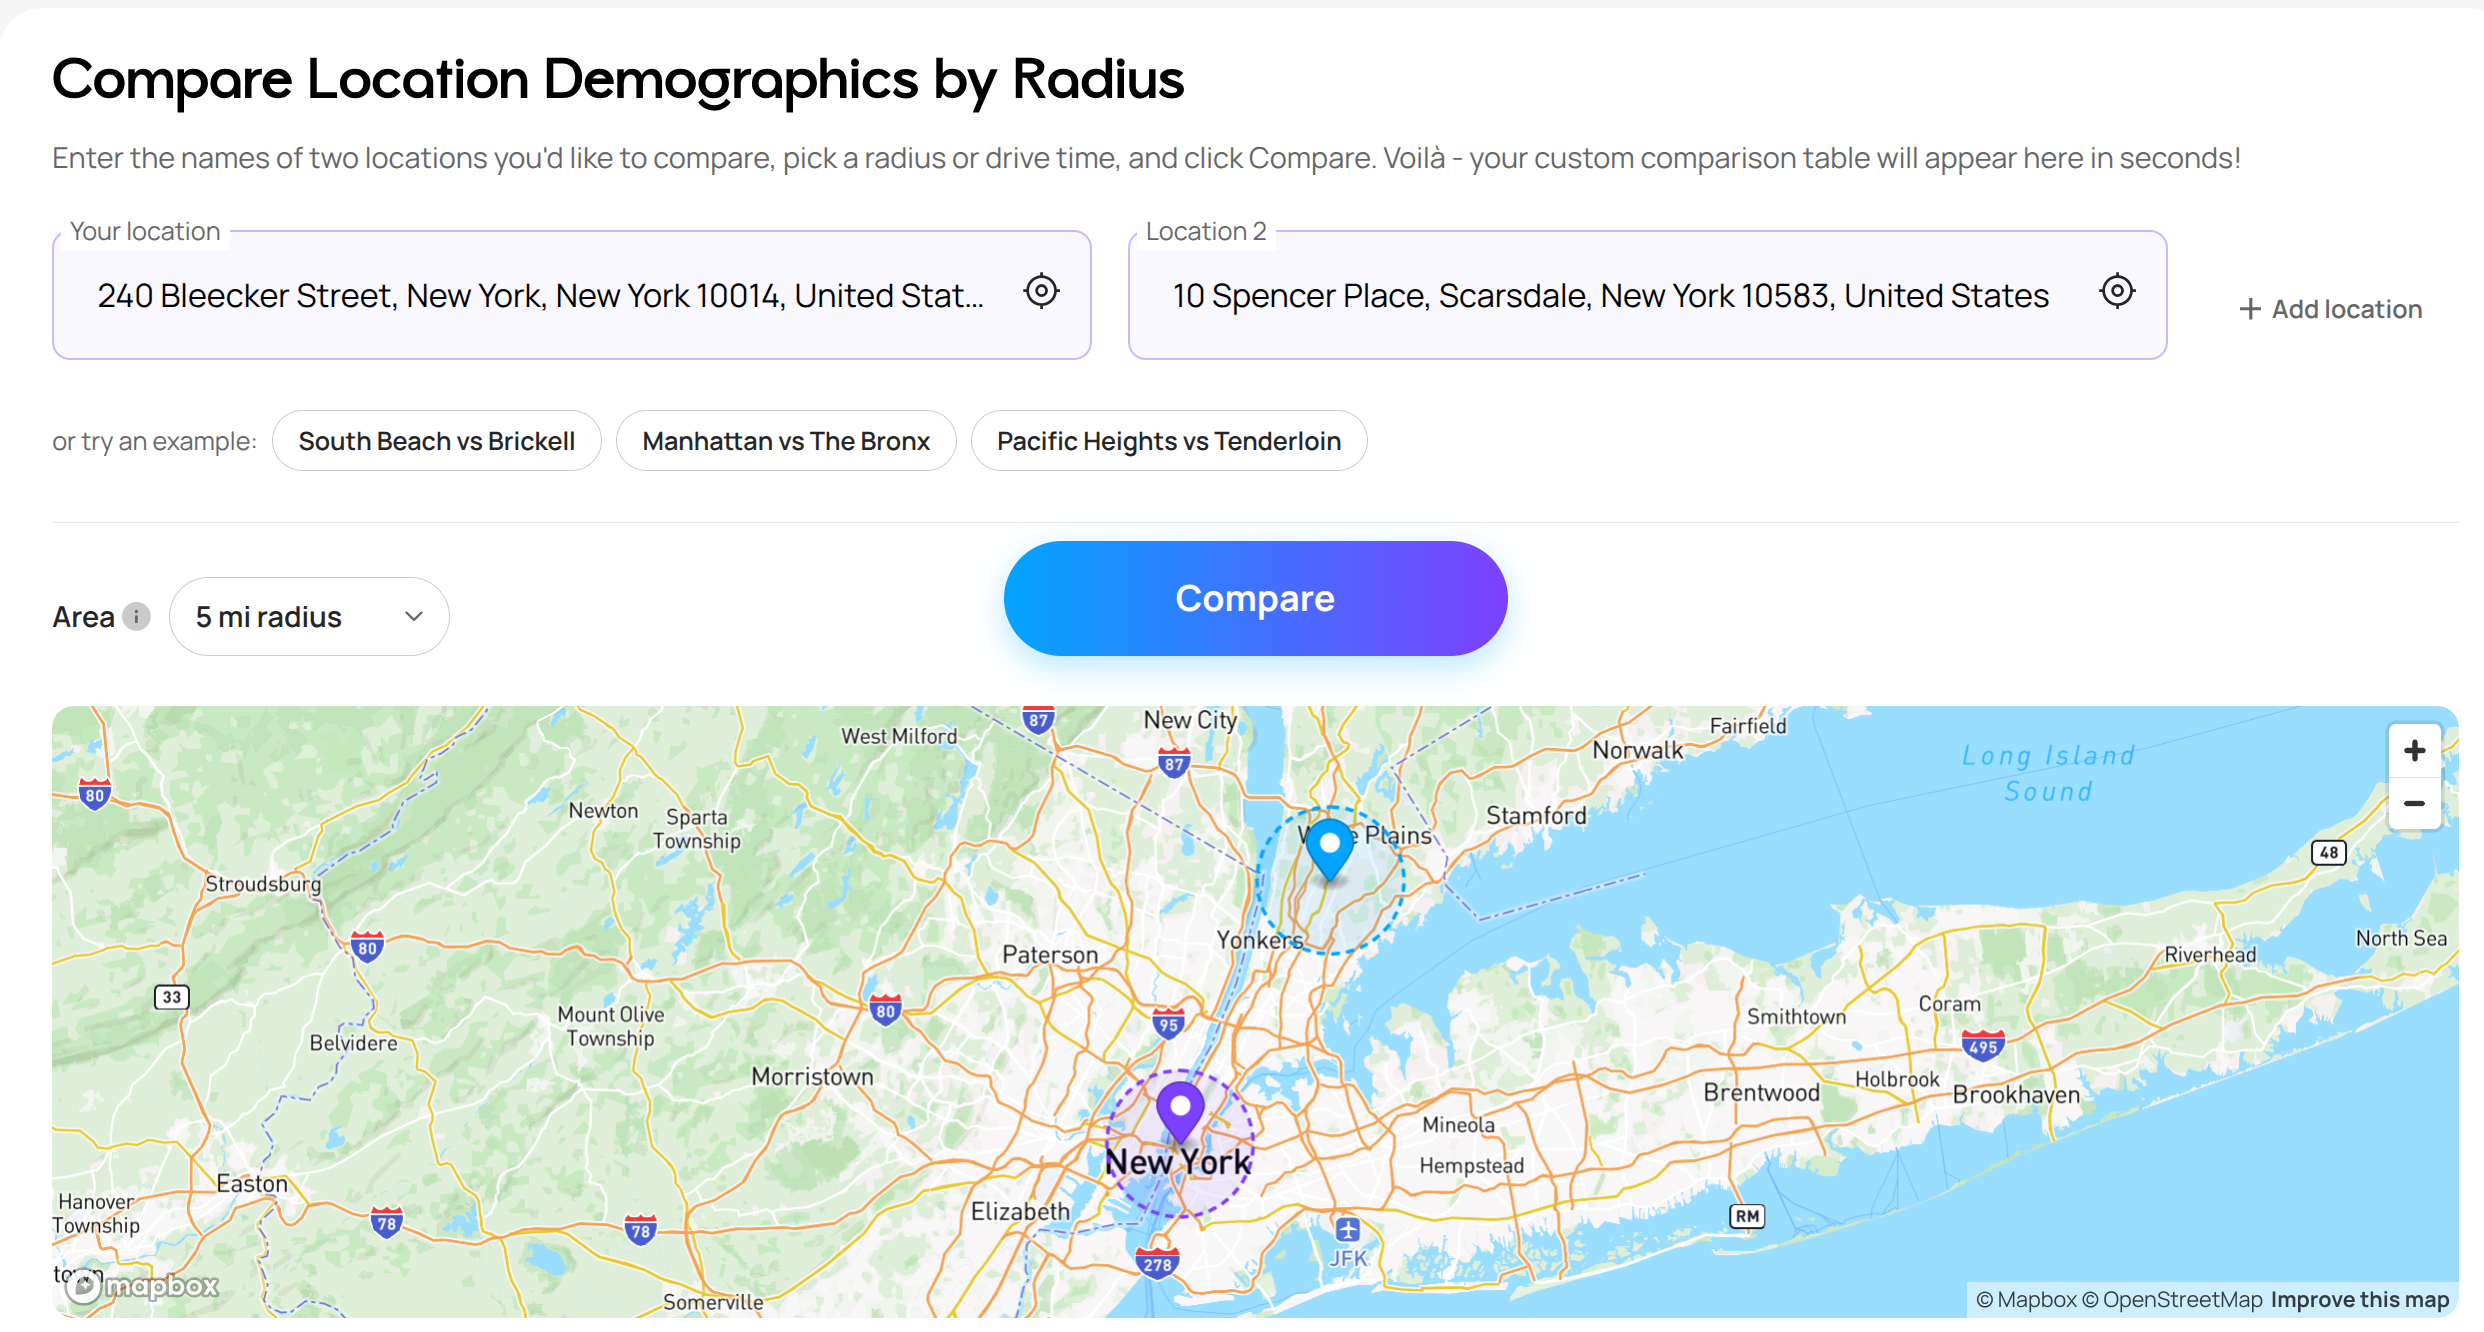
Still searching for the right place?
Use Map AI to explore, compare, and find the best fit - all with detailed insights and smart reports on any neighborhood.


