By Tim Oshchepkov, CTO at Map AI. Updated November 3, 2026.
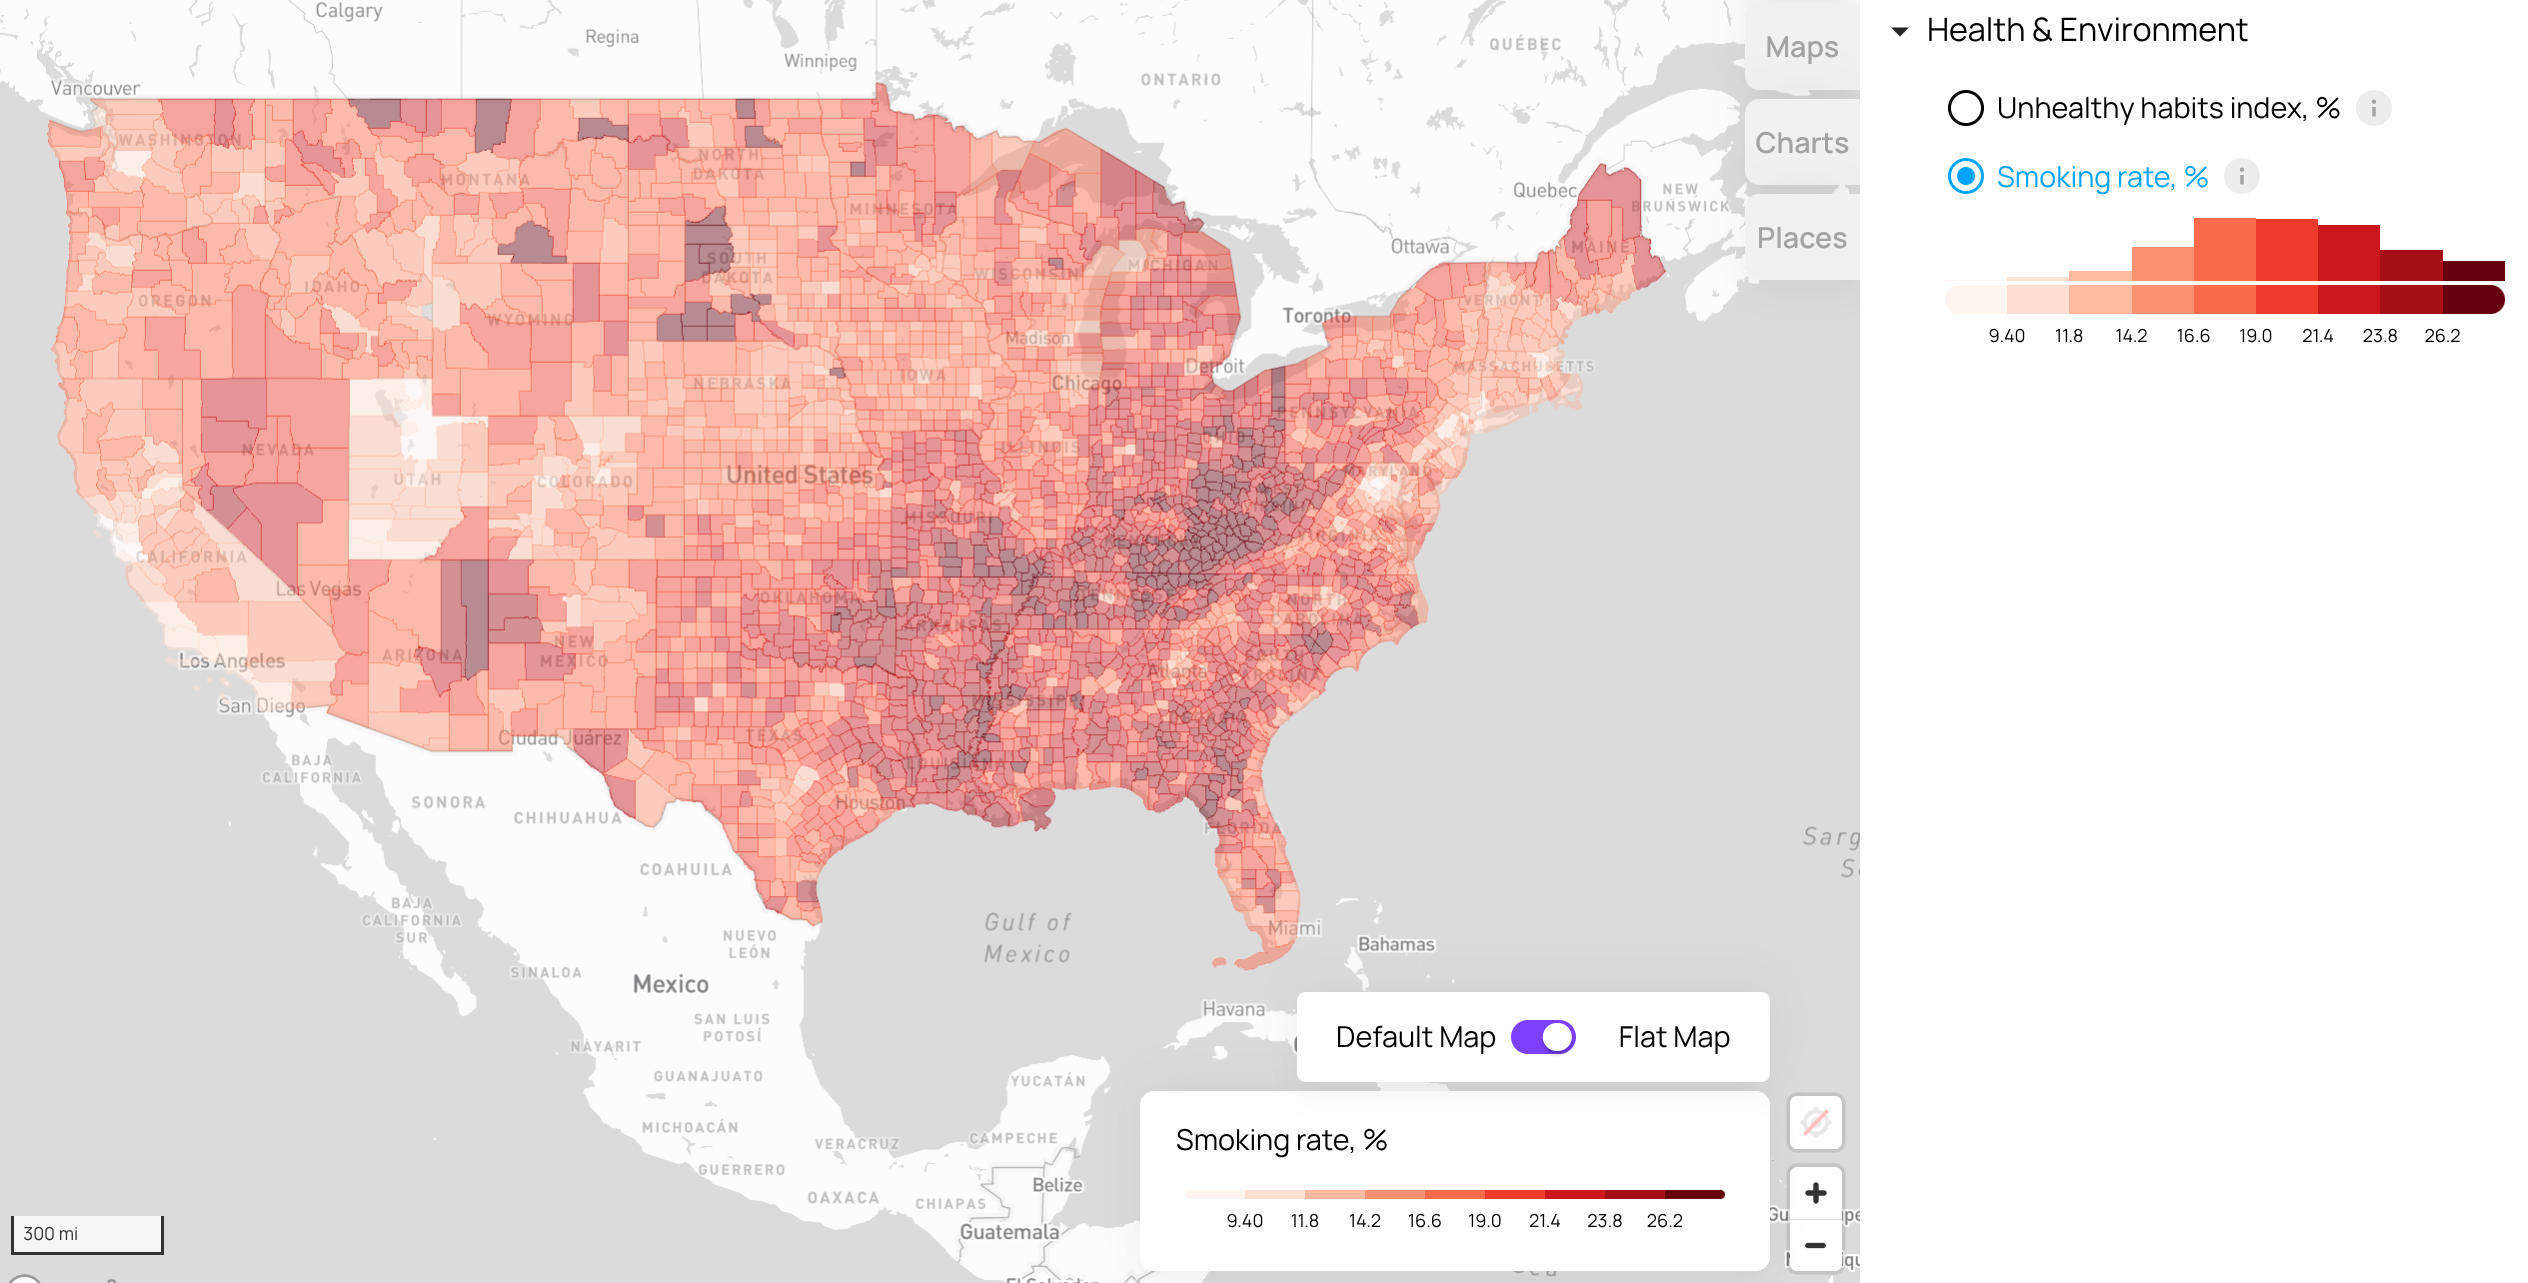
The adult smoking rate in Kusilvak Census Area, Alaska is 42%, the highest of any US county. In Utah County, Utah it is 7%, the lowest. The highest rate is six times the lowest.
Smoking rate is self-reported smoking among adults aged 18 and older, from 2020 CDC data, rounded to the nearest percent.
Where the highest and lowest smoking rates cluster
County-level data analyzed by Map AI shows that both ends of the ranking come from a handful of regions:
- 10 of the 15 highest-smoking counties are in Appalachian Kentucky and West Virginia.
- The 5 highest are Native regions of Alaska and the Dakotas.
- The 3 lowest are all in Utah.
- 5 of the 15 lowest are Washington, DC suburbs in Virginia and Maryland.
The 15 US counties with the highest smoking rates
- 1KusilvakAK42%
- 2ToddSD41%
- 3Oglala LakotaSD39%
- 4BuffaloSD38%
- 5SiouxND36%
- 6MartinKY35%
- 7FloydKY34%
- 8BreathittKY34%
- 9ClayKY34%
- 10MagoffinKY34%
- 11McDowellWV33%
- 12WolfeKY33%
- 13PerryKY33%
- 14LeslieKY33%
- 15KnottKY33%
The very highest rates are in Alaska and Native regions of the Dakotas, but most of the rest of the top 15 is in Kentucky and West Virginia. These areas share longstanding challenges with tobacco use, driven by historic, economic, and cultural factors.
The 15 US counties with the lowest smoking rates
Drawn on the same scale as the list above.
- 1UtahUT7%
- 2SummitUT8%
- 3DavisUT8%
- 4Falls ChurchVA9%
- 5Santa ClaraCA9%
- 6HowardMD9%
- 7HunterdonNJ9%
- 8DouglasCO9%
- 9MarinCA9%
- 10ArlingtonVA9%
- 11FairfaxVA10%
- 12MontgomeryMD10%
- 13CollinTX10%
- 14KingWA10%
- 15NassauNY10%
Utah has the three lowest smoking rates in the country, a result of strong cultural discouragement of tobacco use. Affluent suburban counties in California, Maryland, Virginia, and New Jersey fill out the rest of the list, reflecting the link between higher socioeconomic status and healthier behaviors.
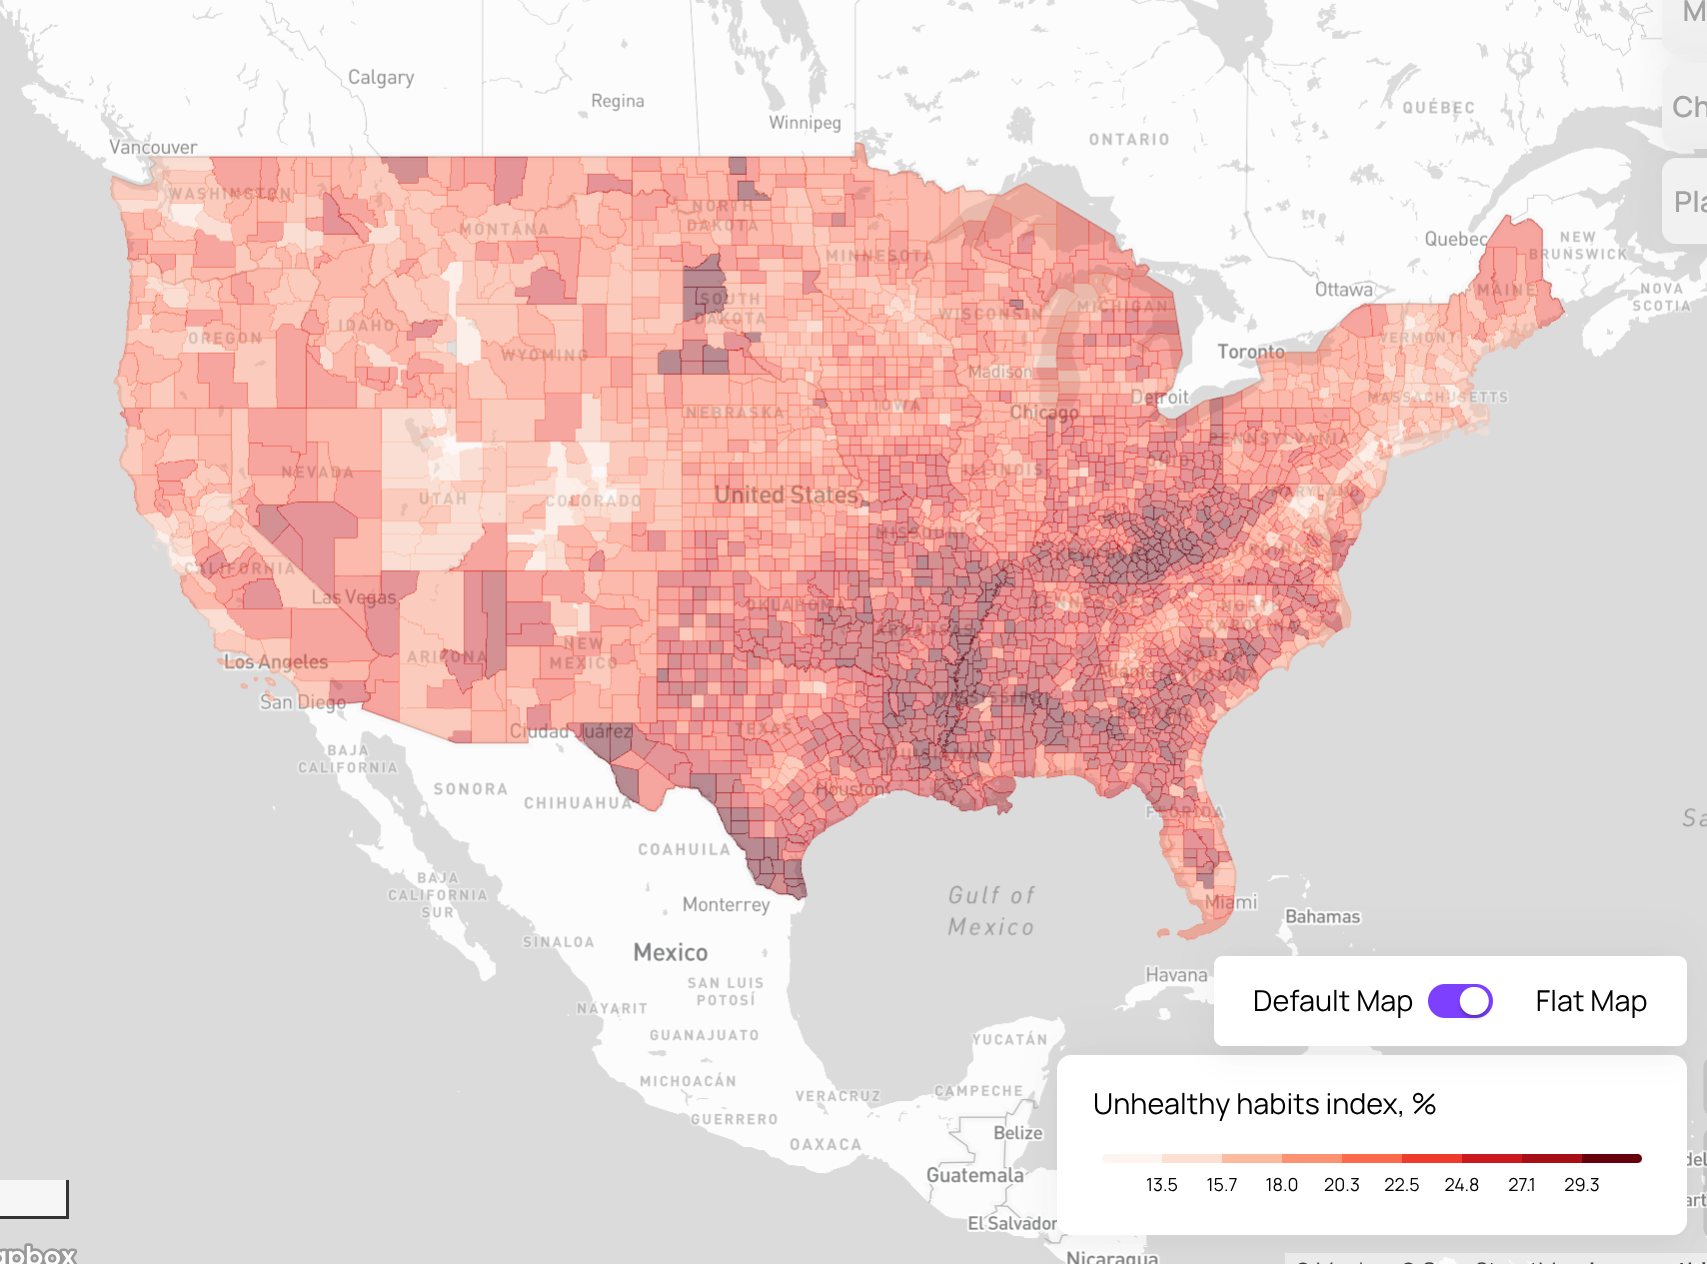
The same places show up on another health ranking. Clay County, KY is among the 15 highest-smoking counties and also among the 15 most sedentary US counties, while Marin, CA and Douglas, CO make both low lists.
How many cigarettes do these counties smoke?
Map AI’s county health pages turn the smoking rate into a rough cigarette count: smokers (the rate times the adult population), times an assumed 10 cigarettes a day each. They then convert cigarettes into time, using an estimate of 11 minutes of life lost per cigarette from Shaw, Mitchell and Dorling in the BMJ (2000), and express that time in lifetimes using the county’s life expectancy.
Run that math on the two lists and the ranking flips. Utah County has the lowest smoking rate in the country, yet its smokers go through about 122.9 million cigarettes a year, 3.7 times as many as the five highest-smoking counties combined. Those five are rural and small. Utah County has about 480,000 adults.
* Map AI has no county life expectancy figure for Kusilvak or Oglala Lakota, so these two use their state’s: 79.9 years for both Alaska and South Dakota. Nearby high-smoking counties have shorter lives (74.7 years in Todd County), so both figures likely understate the loss. Linked counties open their full health page on Map AI.
Together, the five lowest-smoking counties smoke about 21 times as many cigarettes as the five highest, 87% of it in Santa Clara and Utah counties. Per person, the picture flips back: at 42%, Kusilvak works out to about 1,533 cigarettes a year for every adult in the county, smokers and non-smokers alike, against about 256 in Utah County at 7%. The rate is the better guide to individual risk. The total shows where the most tobacco is actually smoked.
Utah County, UT, as shown on its Map AI health page
Assuming each smoker smokes 10 cigarettes a day, that’s about 336,833 cigarettes a day, 10.1 million a month, or 122.9 million a year.
At 11 minutes* of life lost per cigarette, that’s about 3.7 million minutes a day and 1.4 billion a year lost to smoking overall. Since life expectancy in Utah County is 80.0 years, that’s roughly equivalent to 0.09 lifetimes a day, or 32 lifetimes a year.
* Source: Shaw M, Mitchell R, Dorling D. “Time for a smoke? One cigarette reduces your life by 11 minutes.” BMJ. 2000;320:53.
Illustrative only. This is not an estimate of how many people actually die from smoking each day or year. It is a rough, order-of-magnitude comparison meant to help grasp the scale of smoking in this area. We take no responsibility for any decisions made based on this figure.
What these numbers do not show
The smoking rates are 2020 survey-based estimates for each county, not counts, and small counties like Kusilvak (about 4,700 adults) carry more uncertainty than large ones. Rates here are rounded to whole percents, so ties within the lists are not exact. The cigarette totals rest on the 10-a-day assumption and on Map AI’s current adult population figures, so they show scale, not a measured consumption. A county’s rate also says nothing about why its residents smoke: the regional patterns above line up with history, income and culture, but this data does not separate those causes.
Conclusion: a low smoking rate does not mean few cigarettes
The gap between the highest and lowest smoking counties is sixfold. Local history, economic hardship, and cultural attitudes all shape smoking rates, from high-prevalence Appalachia and remote Alaska to health-conscious tech hubs and prosperous suburbs. But a low rate in a big county can still mean far more cigarettes than a high rate in a small one, which matters for anyone planning where tobacco-cessation programs will reach the most people.
Look up your own county. The Map AI smoking map covers every US county, and each county health page runs the same cigarette math shown above.
Open the smoking map