
Still searching for the right place?
Use Map AI to explore, compare, and find the best fit - all with detailed insights and smart reports on any neighborhood.

Racial Demographics: Brookline, MA vs. Milton, MA


March 24, 2025

3 min to read
With Map AI, it's easy to access detailed insights into the ethnic population distribution of any location. Whether you're analyzing your own neighborhood or comparing two towns, Map AI provides a clear snapshot of demographics by race, helping you make informed decisions.
How to see racial demographics on Map AI
Curious about the racial demographics of Brookline, MA, and Milton, MA?
Simply open the map, enter the address of your location in the top-left corner, and explore the area. You'll instantly see a breakdown of racial and ethnic data at your fingertips.
Brookline vs Milton diversity
Brookline

The majority of Brookline's population (63.4%) identifies as White. While this group remains dominant, the town's demographic landscape reflects broader diversity, with 17.3% Asian and 7.45% African American residents.
Milton

Nearly three-quarters of Milton’s residents are White (74.9%), while the other two largest groups are Asian (8.82%) and African American (7.71%).
Here’s the detailed comparison:

What the difference means for homebuyers
Brookline’s chart reflects its urban-adjacent energy, while Milton’s leans toward a more homogeneous, small-town feel. For homebuyers, this data is gold—diversity might signal a vibrant cultural scene or specific community resources, like language programs or ethnic grocery stores.
Map AI doesn’t just throw numbers at you; its interactive map lets you explore surrounding areas too, so you can see how these towns fit into the bigger picture.
Curious about your dream neighborhood’s makeup? Visit our map, plug in a location, and let the pie charts guide your next move!
Compare any two towns. Race, age, income and household data for every US town and neighborhood, down to 1-mile cells.
Open Map AIMore data: Brookline, MA and Milton, MA on Map AI.
Just for you
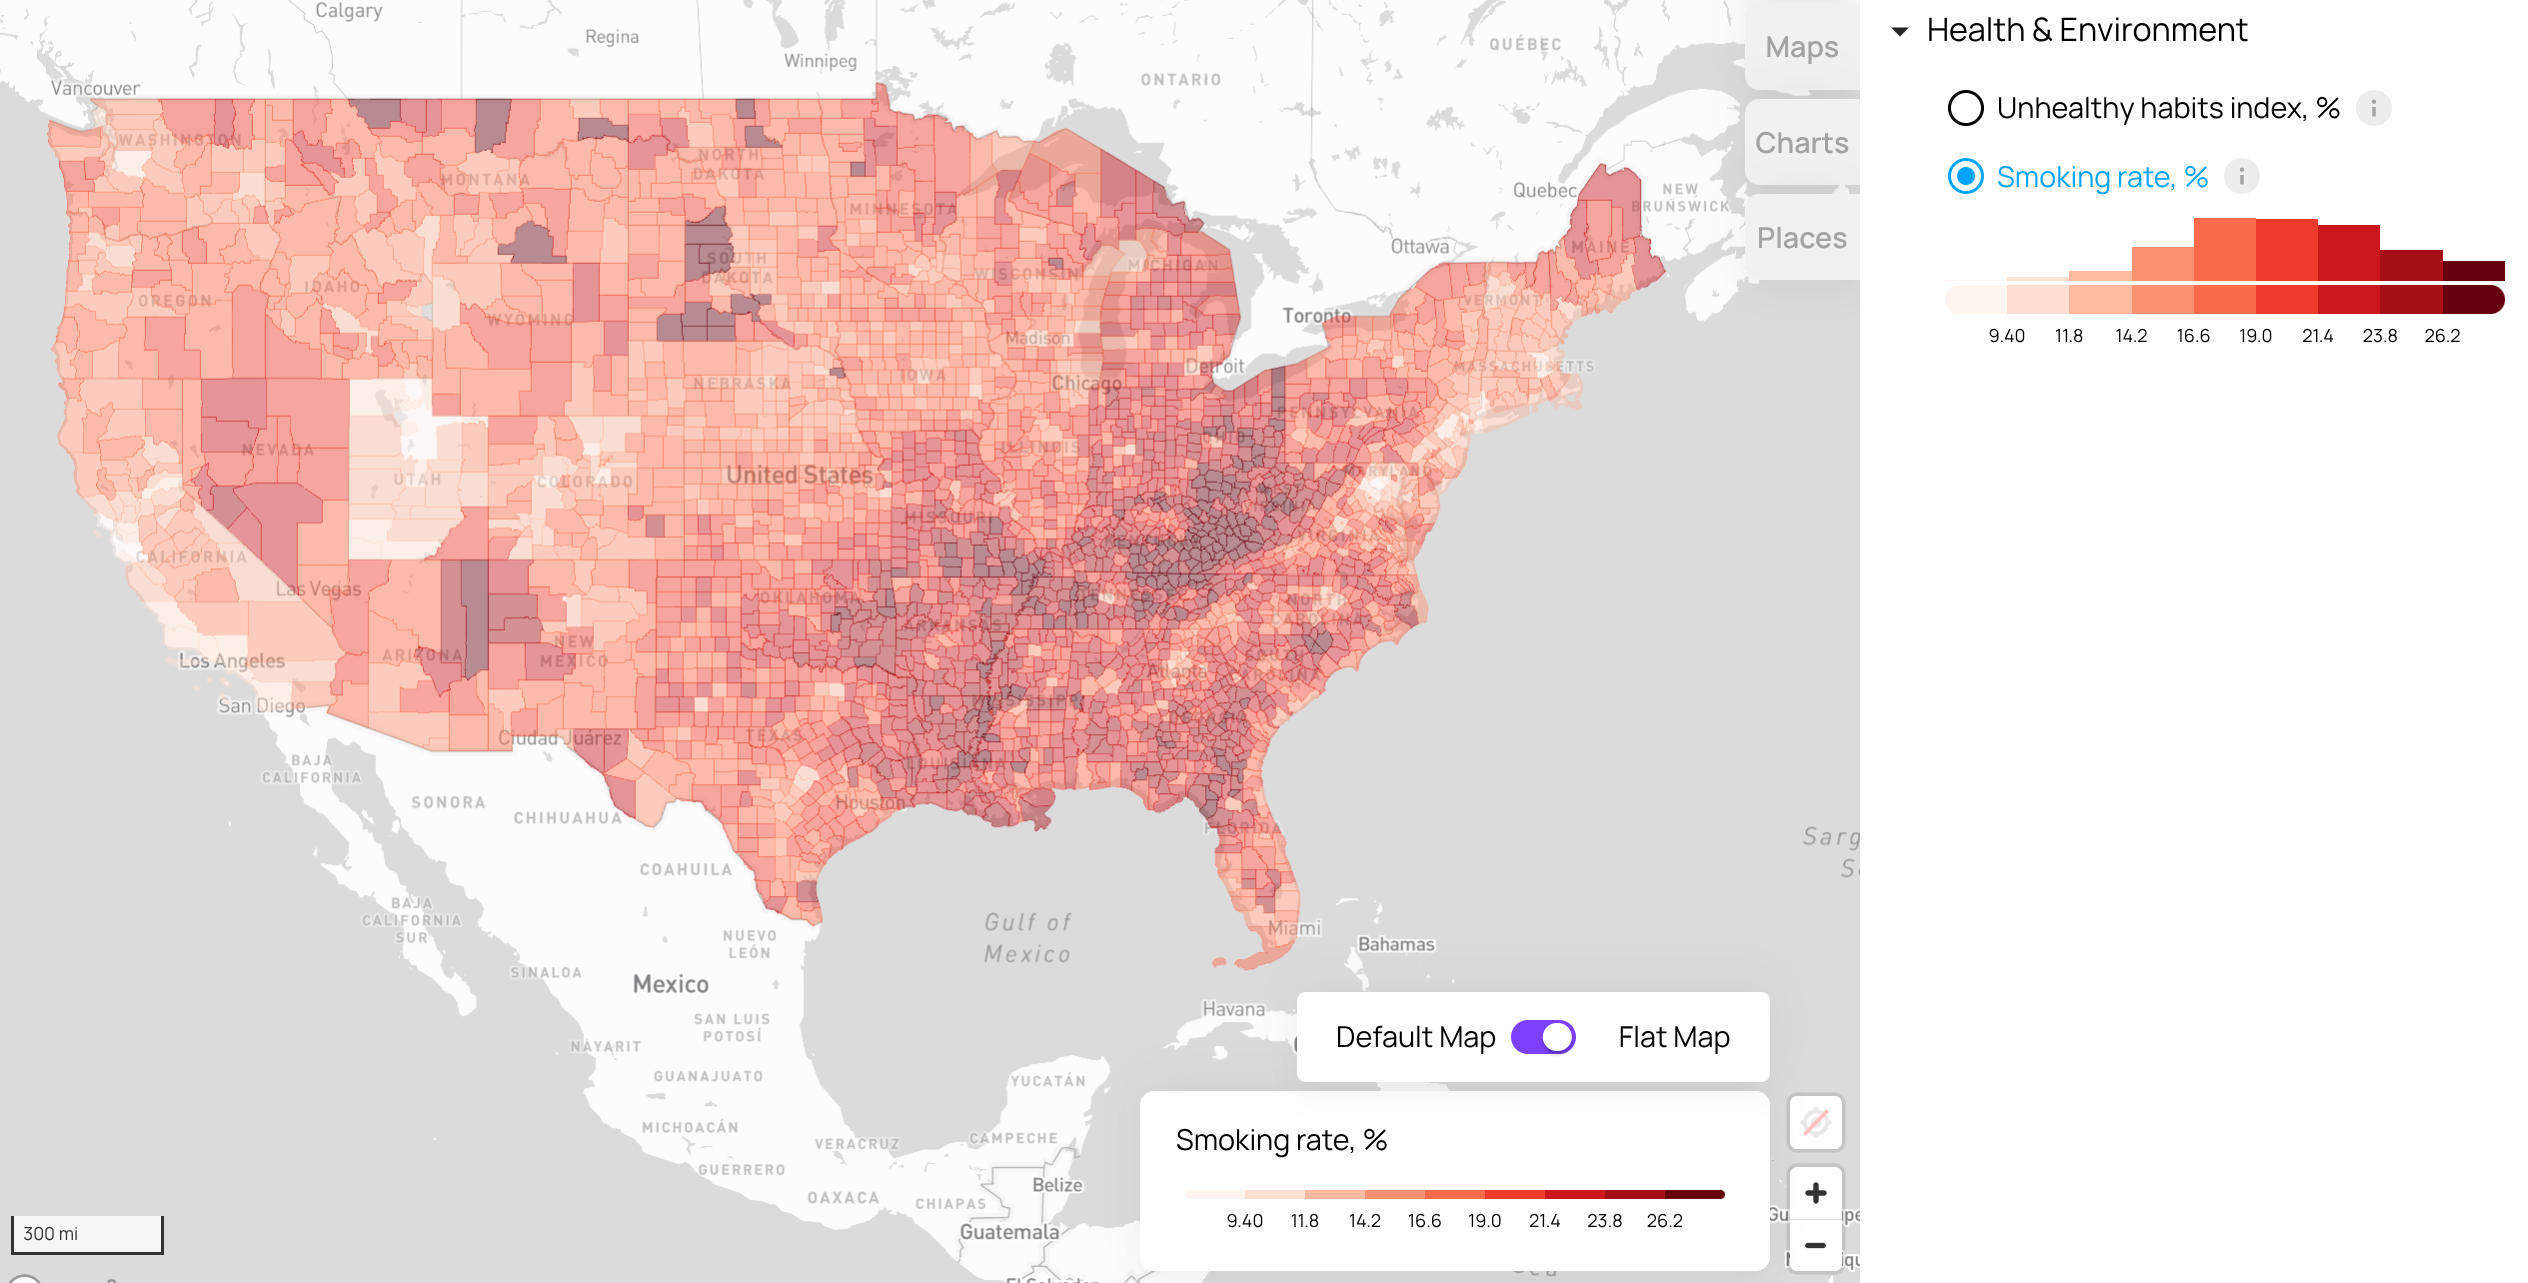
Smoking Rates by US County: The Highest and Lowest in America
The 15 US counties with the highest and lowest adult smoking rates, where they cluster, and how many cigarettes each one smokes a year.
Read more
Still searching for the right place?
Use Map AI to explore, compare, and find the best fit - all with detailed insights and smart reports on any neighborhood.


